There has been a lot of debate about power cords and their impact on the system. Aside from a defective or severely undersized cord I am a skeptic, largely because a few feet of cable is not going to change the rest of the wiring in your house and beyond. However, I do want to clear up some misconceptions about the bandwidth of signals coming out of your outlet. (OK, I admit that is a fanciful, wishful thought, but "clear up" is as good a choice of words as any for this). I am going to hand wave my way through a lot of technical details so purists please take note. This is not meant to be (and is not) a rigorous analysis.
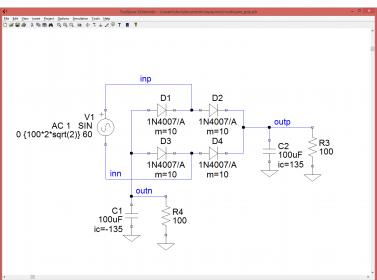
I set up a very simple schematic (below). The voltage source represents the output of your power transformer. There are four diodes arranged in a full-wave bridge. For simplicity I used ten 1N4007A diodes in parallel to provide 10 A nominal current handling. The output drives (+) and (-) rail filter capacitors and load resistors. For this example the output voltage is going to be roughly 100 ~ 150 V so the resistors provide a constant load of 1 - 1.5 A. For this simple example I did not try to model an AC (dynamic) load that an amplifier in operation would present to the supply. Maybe later...
I ran a quick simulation to look at the input and output voltages and currents. The top plot shows the input voltage to the diode bridge in red and blue. The output after the diodes is shown in green and cyan (light blue). Now, diodes work only one way; that is, they conduct voltage (and current) in only one direction. You can see the output voltage rises with the input signal’s peaks and then drops between peaks. The amount of drop (droop) depends upon both the capacitors and the load current:
I = C * dV/dt
Where I = current, C = capacitance, dV = change in voltage, and dt = change in time. For a given load current, to reduce the droop (voltage ripple) we can increase the capacitance or decrease the time period between charging intervals. The former is a common mod; the latter is one reason switching supplies (that operate well above our 60 Hz line frequency – 50 Hz across the pond) are promising.
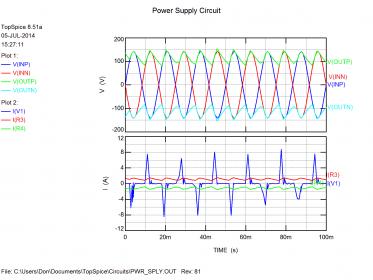
The bottom plot, showing the input and load currents, is very interesting. The output currents (red and green traces), into the load resistors, are pretty constant. Those great big current spikes (blue trace) are coming from the input voltage source, which ultimately represents the current drawn from your wall outlet. Those are the current spikes from charging the filter capacitors. They occur at the signal peaks when the diodes turn on and the supply has to charge up the capacitors, which have drooped during the diodes’ off time. Note they are much larger than the load current for this example. In the real world of audio amplifiers the load is not constant and things get a lot more complicated, but the point is that the input current in this simple static load case is mostly charging the capacitors in quick bursts. With load current of maybe 1.5 A, the input is supplying ~8 A peaks to charge the filter capacitors. Next some frequency plots...
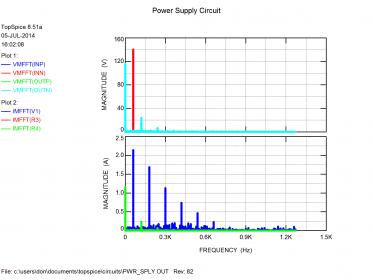
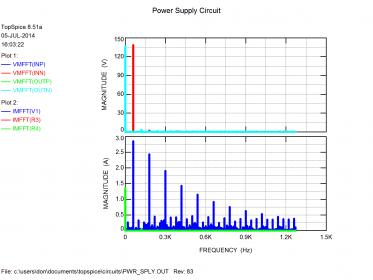
Looking at the top spectral (FFT) plot, the input voltage is essentially a single peak at 60 Hz as expected. Also expected, the output is mostly DC (0 Hz) with a 120 Hz ripple current from the full-wave diode bridge. The load current spectrum (bottom plot, green trace) is essentially the same as the load voltage, but you can see a series of spurs extending past 600 Hz for the input current. Not very high frequency, but remember this is from the wall socket, thus it is ten times the fundamental wall frequency.
The obvious question is how this changes if we increase the filter caps to reduce the output ripple. The results (below) may be surprising… You can see the ripple voltage is greatly reduced going from 100 uF to 1000 uF capacitors, but the current spikes are much larger! The output current has been smoothed much as the output voltage, but the input current spikes are much larger. Remember current (I) is directly related to capacitance (C) so the larger capacitors are demanding much more current during the charging cycles even if the load is not. Since my input voltage source is ideal, it provides the current demanded, and you see the results.
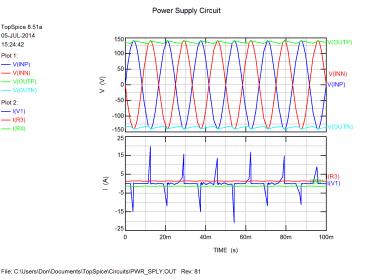
The FFT’s show reduced ripple voltage and current at the output but reflects the larger current spikes with energy past 1 kHz.
What does all this mean for a power cord? Well, if we had a superconducting power cord it would still be limited by the wall socket. Having a cord the same gauge as the wire in the wall to the socket is quite probably good enough. A cord that adds a shield and capacitance might help reduce the frequency content of the current spikes that gets both radiated and drawn from the wall. I have no idea if the aftermarket cords help with that. Finally, any connection can add resistance, so clean, tight plugs and jacks could certainly be important. It is quite possible (at least in my mind) that some of the benefit of a cable swap is due to simple wiping action that cleans oxidation off the connections and provides lower power impedance. Swapping back to the original cable, or better yet having somebody do it for you at a time unknown to you, might help determine if that is the case.
Finally, this is meant to be a quick look and is by no means representative of all the possible cases of supply and load interaction. It does not include a dynamic load, and provides no insight about an amplifier’s resistance to power supply ripple (PSRR) or anything else. I merely wanted to show folk who might not have ever looked at the signals around their power supply some of the things going on.
FWIWFM, HTH, etc. - Don
Edit: I used PNG tpo save the file resolution instead of JPEGs this time, but they came out very small, sorry guys. They are big on my monitor!
I set up a very simple schematic (below). The voltage source represents the output of your power transformer. There are four diodes arranged in a full-wave bridge. For simplicity I used ten 1N4007A diodes in parallel to provide 10 A nominal current handling. The output drives (+) and (-) rail filter capacitors and load resistors. For this example the output voltage is going to be roughly 100 ~ 150 V so the resistors provide a constant load of 1 - 1.5 A. For this simple example I did not try to model an AC (dynamic) load that an amplifier in operation would present to the supply. Maybe later...

I ran a quick simulation to look at the input and output voltages and currents. The top plot shows the input voltage to the diode bridge in red and blue. The output after the diodes is shown in green and cyan (light blue). Now, diodes work only one way; that is, they conduct voltage (and current) in only one direction. You can see the output voltage rises with the input signal’s peaks and then drops between peaks. The amount of drop (droop) depends upon both the capacitors and the load current:
I = C * dV/dt
Where I = current, C = capacitance, dV = change in voltage, and dt = change in time. For a given load current, to reduce the droop (voltage ripple) we can increase the capacitance or decrease the time period between charging intervals. The former is a common mod; the latter is one reason switching supplies (that operate well above our 60 Hz line frequency – 50 Hz across the pond) are promising.

The bottom plot, showing the input and load currents, is very interesting. The output currents (red and green traces), into the load resistors, are pretty constant. Those great big current spikes (blue trace) are coming from the input voltage source, which ultimately represents the current drawn from your wall outlet. Those are the current spikes from charging the filter capacitors. They occur at the signal peaks when the diodes turn on and the supply has to charge up the capacitors, which have drooped during the diodes’ off time. Note they are much larger than the load current for this example. In the real world of audio amplifiers the load is not constant and things get a lot more complicated, but the point is that the input current in this simple static load case is mostly charging the capacitors in quick bursts. With load current of maybe 1.5 A, the input is supplying ~8 A peaks to charge the filter capacitors. Next some frequency plots...

Looking at the top spectral (FFT) plot, the input voltage is essentially a single peak at 60 Hz as expected. Also expected, the output is mostly DC (0 Hz) with a 120 Hz ripple current from the full-wave diode bridge. The load current spectrum (bottom plot, green trace) is essentially the same as the load voltage, but you can see a series of spurs extending past 600 Hz for the input current. Not very high frequency, but remember this is from the wall socket, thus it is ten times the fundamental wall frequency.
The obvious question is how this changes if we increase the filter caps to reduce the output ripple. The results (below) may be surprising… You can see the ripple voltage is greatly reduced going from 100 uF to 1000 uF capacitors, but the current spikes are much larger! The output current has been smoothed much as the output voltage, but the input current spikes are much larger. Remember current (I) is directly related to capacitance (C) so the larger capacitors are demanding much more current during the charging cycles even if the load is not. Since my input voltage source is ideal, it provides the current demanded, and you see the results.

The FFT’s show reduced ripple voltage and current at the output but reflects the larger current spikes with energy past 1 kHz.

What does all this mean for a power cord? Well, if we had a superconducting power cord it would still be limited by the wall socket. Having a cord the same gauge as the wire in the wall to the socket is quite probably good enough. A cord that adds a shield and capacitance might help reduce the frequency content of the current spikes that gets both radiated and drawn from the wall. I have no idea if the aftermarket cords help with that. Finally, any connection can add resistance, so clean, tight plugs and jacks could certainly be important. It is quite possible (at least in my mind) that some of the benefit of a cable swap is due to simple wiping action that cleans oxidation off the connections and provides lower power impedance. Swapping back to the original cable, or better yet having somebody do it for you at a time unknown to you, might help determine if that is the case.
Finally, this is meant to be a quick look and is by no means representative of all the possible cases of supply and load interaction. It does not include a dynamic load, and provides no insight about an amplifier’s resistance to power supply ripple (PSRR) or anything else. I merely wanted to show folk who might not have ever looked at the signals around their power supply some of the things going on.
FWIWFM, HTH, etc. - Don
Edit: I used PNG tpo save the file resolution instead of JPEGs this time, but they came out very small, sorry guys. They are big on my monitor!
Last edited:

