Hi Guys,
I thought I'd a share a robust, real-world experimental, statistically-based technique called Design of Experiments to optimize setup of a REL sub into my 2-channel stereo system.
NOTE:
While some might be of the view this thread would be a better "fit" in the 'Subwoofer/Speaker" forum, the reason I am posting it here in the Audio Tweaks Forum is because DOEs are incredibly powerful tools and you can use it for many audio applications. For example, you could use it to optimize speaker R&D during development, speaker placement, cartridge alignment and setup, just as a few examples. Please bear that in mind while reading this article, DOEs are NOT limited solely to subwoofer integration to a 2-channel stereo system. Thanks.
For those interested, first I'm posting an introduction to Design of Experiments here:
________________
When I started to look at how to effectively integrate my REL R-305 subwoofer with a pair of "mains" speakers using a statistical approach called Design of Experiments to optimize integration of subwoofers for a given room with a set of "mains" speakers.
To start with here is an introduction to Design of Experiments.
Description
Design of experiments (DOE) is a powerful tool that can be used in a variety of experimental situations. DOE allows for multiple input factors to be manipulated determining their effect on a desired output (response). By manipulating multiple inputs at the same time, DOE can identify important interactions that may be missed when experimenting with one factor at a time. All possible combinations can be investigated (full factorial) or only a portion of the possible combinations (fractional factorial). Fractional factorials will not be discussed here.
When to Use DOE
Use DOE when more than one input factor is suspected of influencing an output. For example, it may be desirable to understand the effect of temperature and pressure on the strength of a glue bond.
DOE can also be used to confirm suspected input/output relationships and to develop a predictive equation suitable for performing what-if analysis.
DOE Procedure
Acquire a full understanding of the inputs and outputs being investigated. A process flow diagram or process map can be helpful. Utilize subject matter experts as necessary.
Determine the appropriate measure for the output. A variable measure is preferable. Attribute measures (pass/fail) should be avoided. Ensure the measurement system is stable and repeatable.
Create a design matrix for the factors being investigated. The design matrix will show all possible combinations of high and low levels for each input factor. These high and low levels can be generically coded as +1 and -1. For example, a 2 factor experiment will require 4 experimental runs:
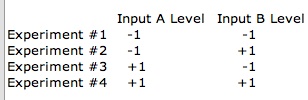
Note: The required number of experimental runs can be calculated using the formula 2n where n is the number of factors.
For each input, determine the extreme but realistic high and low levels you wish to investigate. In some cases the extreme levels may be beyond what is currently in use. The extreme levels selected should be realistic, not absurd. For example:
Enter the factors and levels for the experiment into the design matrix. Perform each experiment and record the results. For example:
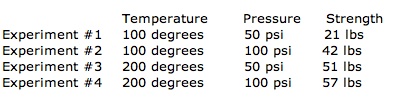
Calculate the effect of a factor by averaging the data collected at the low level and subtracting it from the average of the data collected at the high level. For example:
Effect of Temperature on strength:
(51 + 57)/2 - (21 + 42)/2 = 22.5 lbs
Effect of Pressure on strength:
(42 + 57)/2 - (21 + 51)/2 = 13.5 lbs
The interaction between two factors can be calculated in the same fashion. First, the design matrix must be amended to show the high and low levels of the interaction. The levels are calculated by multiplying the coded levels for the input factors acting in the interaction. For example:
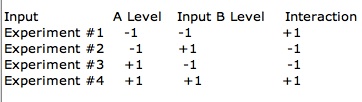
Calculate the effect of the interaction as before.
Effect of the interaction on strength:
(21 + 57)/2 - (42 + 51)/2 = -7.5 lbs
The experimental data can be plotted in a 3D Bar Chart.
This simple-minded example above shows that there is an interaction between temperature and pressure in the strength of the glue bond. This is one feature of DOEs that is particularly useful when looking at the effect of a number of factors and their effect on the critical functional response.
Now that that is out of the way as intro, let's look at the specific experiment I had in mind in the next post.
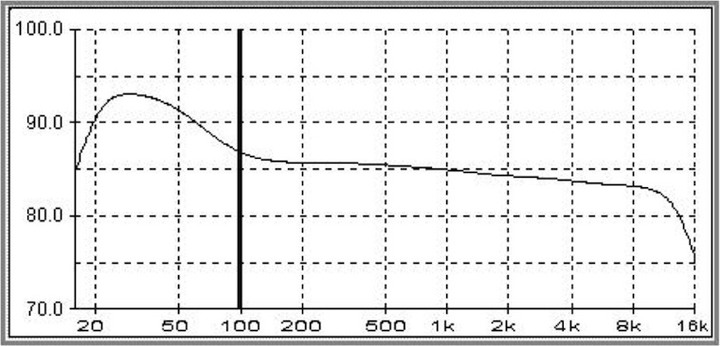
The experiment I was trying to reproduce was the one based on the well-known "Harman curve" showing that listeners perceived a room as having flat room reponse when the measured frequency actually looked more like this. This is because our hearing is not linear at lower frequencies.
Now, one could debate whether the Harman curve is exactly the right curve on which to base this model, but it was a well-characterized "orthogonal reference" as we say in science, and as such, it was the one I decided to use for this experiment. Please keep in mind this was just an experiment I did for fun while recovering from a back operation. What can I say...this is how scientists like myself are "wired"... :lol:
Given this, I set out to to perform a "DOE" to see if I could determine the optimal settings of speakers, REL sub settings and other factors, like grilles on or off, speaker toe-in, port plugs, etc. that would optimize the in-room response.
With that in mind, I set out to see what I could do with my set-up to obtain, as close as possible, the Harman response curve via DOE.
System used at the time was: Conrad-Johnson Premier 17LS Preamp, Conrad-Johnson LP70S, Dynaudio Contour S3.4 speakers, REL R-305, M-Audio MobilePre USB mike preamp, Dayton NIST-traceable calibrated measurement microphone with calibration file, and Room EQ Wizard Software. The Room EQ Wizard software generates and simultaneously measures the frequency sweep from 10 Hz to 20,000 Hz.
The desired responses were to maximize 20 and 50 Hz repsonse in dB, and minimize the 150 and 500 Hz responses. These 150 and 500 Hz responses were nodes that I wanted to minimize, if possible.
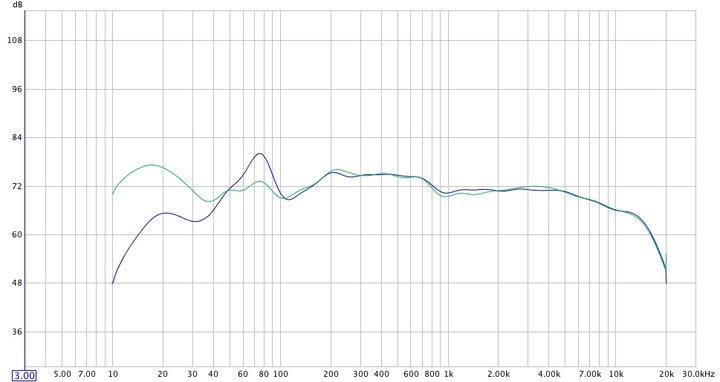
An example trace as my starting point for reference is shown. The purple trace is where I started with the sub in, the brown trace with the sub out, before optimizing things using the DOE approach. The following is the real-time, IN-ROOM measured response for the right speaker:
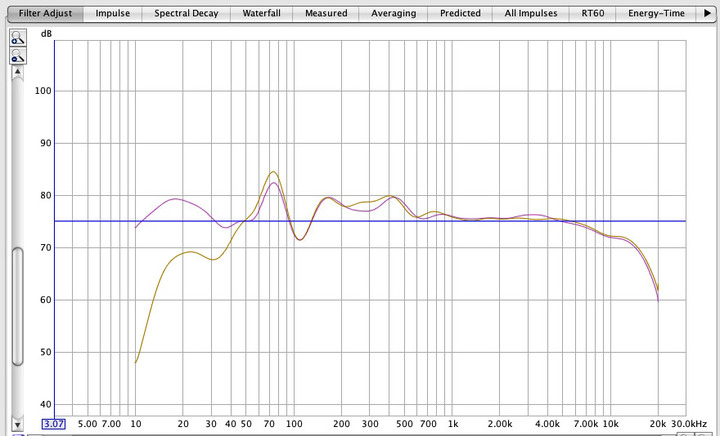
The goal here was to maximize the 20-50Hz node to range, while smothing the 70, and minimizing the 105, 155 and 500 Hz node peaks, so as to emulate the JBL graph.
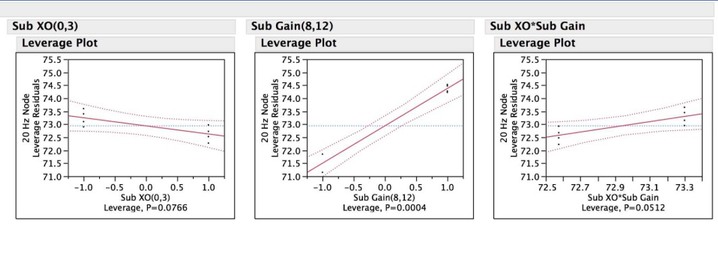
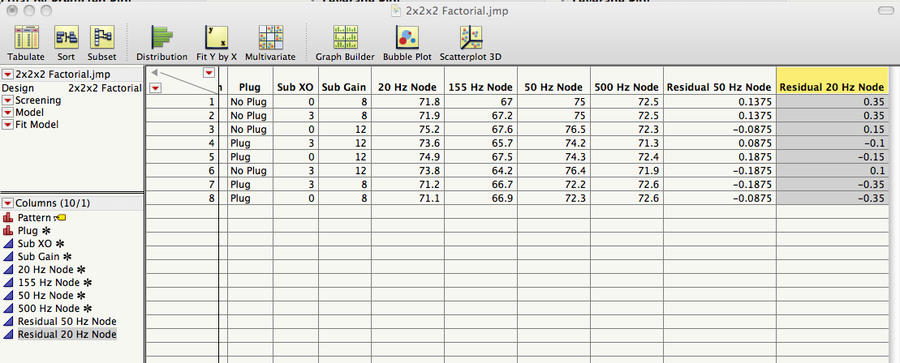
The factors I used for the DOE were sub gain (as clicks up from zero), sub crossover, likewise clicks up from zero, plug or no plug in the speaker reflex port. So, four responses being measured as the result of 3 factors at two different levels (low, high as in the examples above shown).
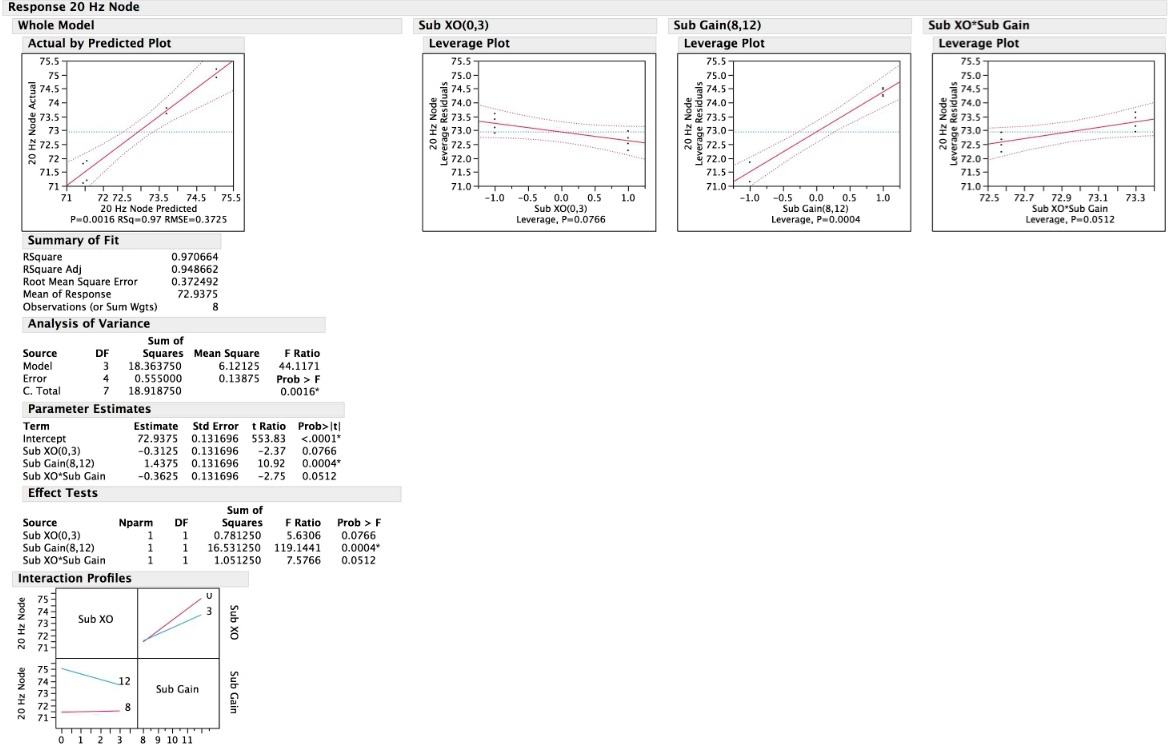
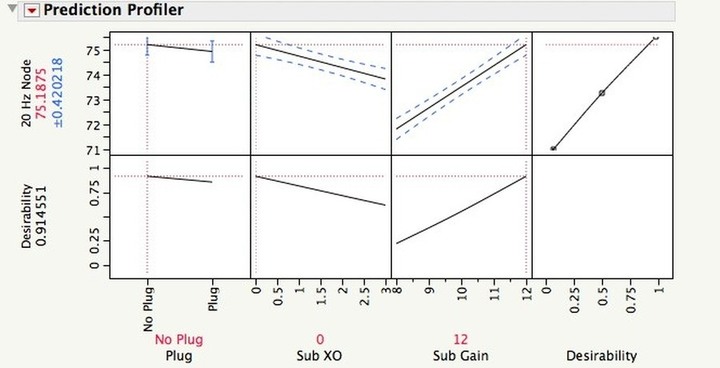
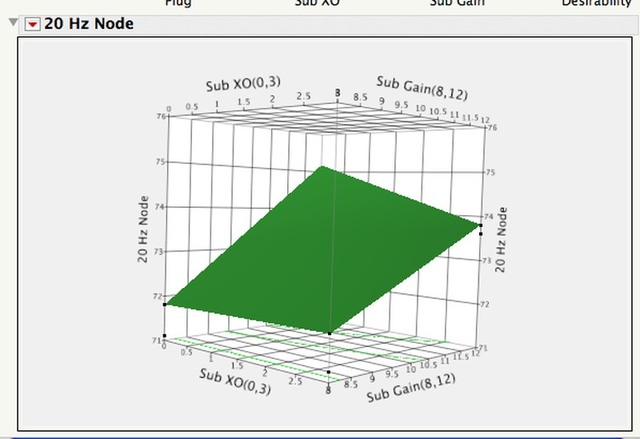
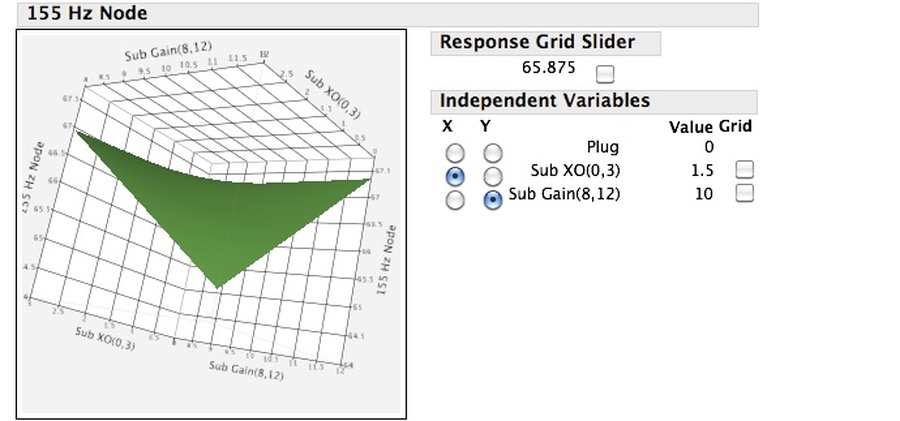
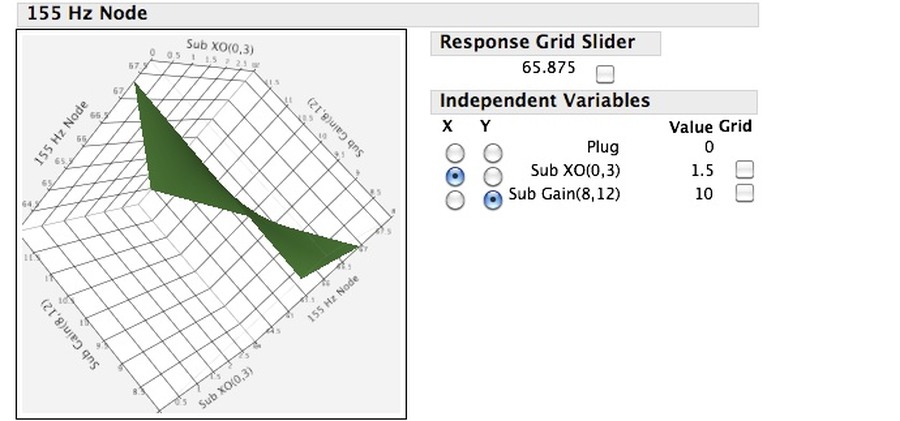
Setting up a full-factorial DOE in JMP (a stastical package), here are the experimental matrix I ran per JMP's output for the experimental design and the ACTUAL measurements for each frequency (as measured in dB by room Eq Wizard).
The next post will be the analysis of the data...
I thought I'd a share a robust, real-world experimental, statistically-based technique called Design of Experiments to optimize setup of a REL sub into my 2-channel stereo system.
NOTE:
While some might be of the view this thread would be a better "fit" in the 'Subwoofer/Speaker" forum, the reason I am posting it here in the Audio Tweaks Forum is because DOEs are incredibly powerful tools and you can use it for many audio applications. For example, you could use it to optimize speaker R&D during development, speaker placement, cartridge alignment and setup, just as a few examples. Please bear that in mind while reading this article, DOEs are NOT limited solely to subwoofer integration to a 2-channel stereo system. Thanks.
For those interested, first I'm posting an introduction to Design of Experiments here:
________________
When I started to look at how to effectively integrate my REL R-305 subwoofer with a pair of "mains" speakers using a statistical approach called Design of Experiments to optimize integration of subwoofers for a given room with a set of "mains" speakers.
To start with here is an introduction to Design of Experiments.
Description
Design of experiments (DOE) is a powerful tool that can be used in a variety of experimental situations. DOE allows for multiple input factors to be manipulated determining their effect on a desired output (response). By manipulating multiple inputs at the same time, DOE can identify important interactions that may be missed when experimenting with one factor at a time. All possible combinations can be investigated (full factorial) or only a portion of the possible combinations (fractional factorial). Fractional factorials will not be discussed here.
When to Use DOE
Use DOE when more than one input factor is suspected of influencing an output. For example, it may be desirable to understand the effect of temperature and pressure on the strength of a glue bond.
DOE can also be used to confirm suspected input/output relationships and to develop a predictive equation suitable for performing what-if analysis.
DOE Procedure
Acquire a full understanding of the inputs and outputs being investigated. A process flow diagram or process map can be helpful. Utilize subject matter experts as necessary.
Determine the appropriate measure for the output. A variable measure is preferable. Attribute measures (pass/fail) should be avoided. Ensure the measurement system is stable and repeatable.
Create a design matrix for the factors being investigated. The design matrix will show all possible combinations of high and low levels for each input factor. These high and low levels can be generically coded as +1 and -1. For example, a 2 factor experiment will require 4 experimental runs:
Note: The required number of experimental runs can be calculated using the formula 2n where n is the number of factors.
For each input, determine the extreme but realistic high and low levels you wish to investigate. In some cases the extreme levels may be beyond what is currently in use. The extreme levels selected should be realistic, not absurd. For example:
Enter the factors and levels for the experiment into the design matrix. Perform each experiment and record the results. For example:
Calculate the effect of a factor by averaging the data collected at the low level and subtracting it from the average of the data collected at the high level. For example:
Effect of Temperature on strength:
(51 + 57)/2 - (21 + 42)/2 = 22.5 lbs
Effect of Pressure on strength:
(42 + 57)/2 - (21 + 51)/2 = 13.5 lbs
The interaction between two factors can be calculated in the same fashion. First, the design matrix must be amended to show the high and low levels of the interaction. The levels are calculated by multiplying the coded levels for the input factors acting in the interaction. For example:
Calculate the effect of the interaction as before.
Effect of the interaction on strength:
(21 + 57)/2 - (42 + 51)/2 = -7.5 lbs
The experimental data can be plotted in a 3D Bar Chart.
This simple-minded example above shows that there is an interaction between temperature and pressure in the strength of the glue bond. This is one feature of DOEs that is particularly useful when looking at the effect of a number of factors and their effect on the critical functional response.
Now that that is out of the way as intro, let's look at the specific experiment I had in mind in the next post.
The experiment I was trying to reproduce was the one based on the well-known "Harman curve" showing that listeners perceived a room as having flat room reponse when the measured frequency actually looked more like this. This is because our hearing is not linear at lower frequencies.
Now, one could debate whether the Harman curve is exactly the right curve on which to base this model, but it was a well-characterized "orthogonal reference" as we say in science, and as such, it was the one I decided to use for this experiment. Please keep in mind this was just an experiment I did for fun while recovering from a back operation. What can I say...this is how scientists like myself are "wired"... :lol:
Given this, I set out to to perform a "DOE" to see if I could determine the optimal settings of speakers, REL sub settings and other factors, like grilles on or off, speaker toe-in, port plugs, etc. that would optimize the in-room response.
With that in mind, I set out to see what I could do with my set-up to obtain, as close as possible, the Harman response curve via DOE.
System used at the time was: Conrad-Johnson Premier 17LS Preamp, Conrad-Johnson LP70S, Dynaudio Contour S3.4 speakers, REL R-305, M-Audio MobilePre USB mike preamp, Dayton NIST-traceable calibrated measurement microphone with calibration file, and Room EQ Wizard Software. The Room EQ Wizard software generates and simultaneously measures the frequency sweep from 10 Hz to 20,000 Hz.
The desired responses were to maximize 20 and 50 Hz repsonse in dB, and minimize the 150 and 500 Hz responses. These 150 and 500 Hz responses were nodes that I wanted to minimize, if possible.
An example trace as my starting point for reference is shown. The purple trace is where I started with the sub in, the brown trace with the sub out, before optimizing things using the DOE approach. The following is the real-time, IN-ROOM measured response for the right speaker:
The goal here was to maximize the 20-50Hz node to range, while smothing the 70, and minimizing the 105, 155 and 500 Hz node peaks, so as to emulate the JBL graph.
The factors I used for the DOE were sub gain (as clicks up from zero), sub crossover, likewise clicks up from zero, plug or no plug in the speaker reflex port. So, four responses being measured as the result of 3 factors at two different levels (low, high as in the examples above shown).
Setting up a full-factorial DOE in JMP (a stastical package), here are the experimental matrix I ran per JMP's output for the experimental design and the ACTUAL measurements for each frequency (as measured in dB by room Eq Wizard).
The next post will be the analysis of the data...
Last edited: