We (Sigberg Audio) have speakers and subs with built-in manual EQ, which is great - but we have many customers who doesn't know how to and/or doesn't want to learn how to use REW and a microphone to measure their system. And even if you don't have EQ, simply understanding the response in the bass and what works best with regards to placement might be difficult by ear only.
After mulling over this problem for a while, I've come up with an idea of how to make it less complicated to do so. If you already have REW, this method isn't necessarily easier or even faster - but it is hopefully easier to understand and get a grip on if you don't have REW and are perhaps less technically inclined.
You don't have to connect your phone to your system, and you don't have to do anything more complicated than entering a few numbers on your PC.
So what do we have:
- A Spotify playlist with sinewaves from 20-100hz in 5hz increments
- A Tidal playlist with sinewaves from 20-100hz in 5hz increments
- The idea is to simply play these back through your system and measure with your smartphone. It won't be perfectly accurate, but the relative level should be accurate enough for the result to be a significant improvement over an uncalibrated system. An iphone or ipad is surprisingly accurate down to around 30hz.
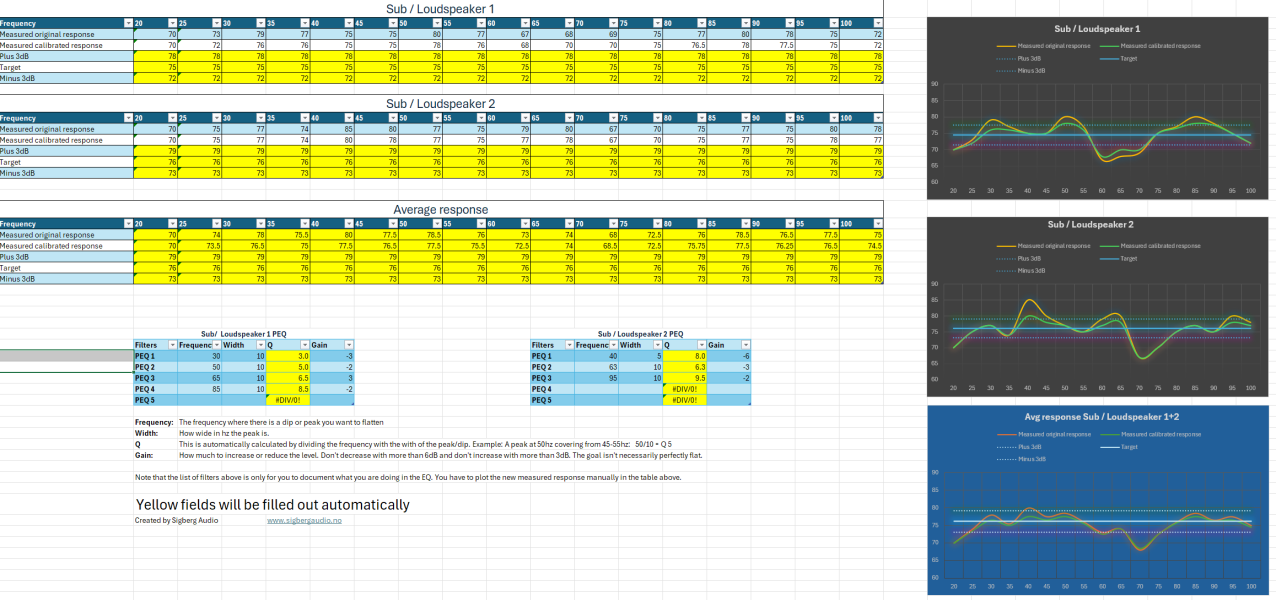
- I've created an excel support sheet where you can fill in the resulting sound level (SPL) of all these sinewaves for each speaker / subwoofer, and get a graph of the corresponding response.
- It also has a section where you fill out and document the PEQ you enter into whatever EQ you have. These won't have any direct effect on the graphs.
- After EQing, you then measure again and fill in new measurements to verify the result, which is also plotted in the graphs
- Finally there's a separate graph that automatically plots the average of your two speakers/subs so that you can consider that when EQing, and/or use that if you have an EQ that only supports stereo EQ.
So this is created to help you EQ your system, but even if you don't have EQ, this can be useful to just measure the response in your room, and also while testing different positions either for the components or your own listening position.
This is a very early version of it all, so I would be very interested to get some feedback and help to develop this into something people can understand before publishing it more widely. The goal isn't for this to be super sophisticated, but rather easy to use. It is initially created with our customers in mind, but in theory it would work for anyone who has access to some kind of PEQ in their system, which is now more and more widely available as it is beginning to be included in streamers and DACs etc. I'll host the file and documentation on our site, and might also consider creating a web version of it (as an alternative to the excel sheet).
Questions:
Do you find this useful at all?
Do you understand how to use it?
Are the instructions clear enough?
Any other obstacles?
Latest version of the excel support document (v0.12 / 2026-06-21):
https://cdn.shopify.com/s/files/1/0284/1427/9783/files/PEQ-Sheet-SigbergAudio.xlsx?v=1718989420
Walk-through of how to use it:

How to optimize your subwoofers for music and get tight, balanced bass in a few easy steps!
Walk-through of how to improve the bass response of your subwoofer(s) / audio system using nothing but Spotify and your phone or tablet! A simpler way to measure and calibrate bass without REW and mic (Excel sheet included)
 www.sigbergaudio.no


