
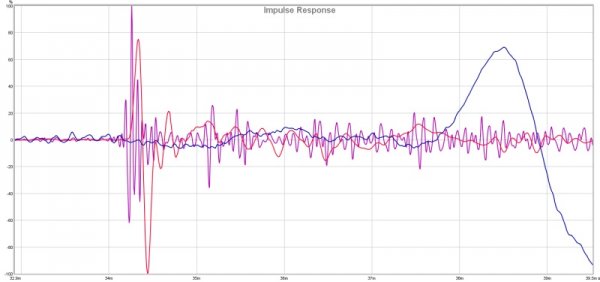
Impulse Response Measurement
- Thread starter jcmusic
- Start date
You are using an out of date browser. It may not display this or other websites correctly.
You should upgrade or use an alternative browser.
You should upgrade or use an alternative browser.
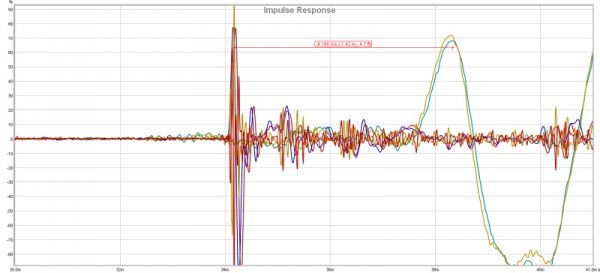
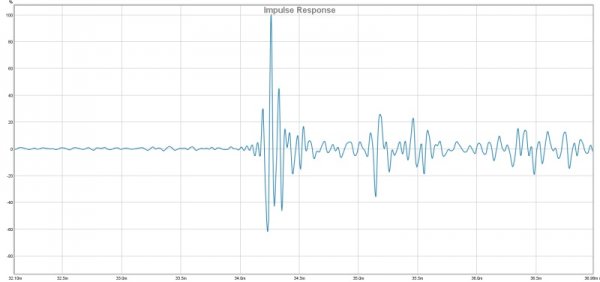
I can't read the scales clearly and I'm not sure what the test pulse frequency was, but why did you designate the duration of the impulse to the first peak (I presume Y and G are your 2 channels?). My understanding is that the impulse delay should be defined by when the first peak begins to rise from the horizontal axis, not when it is already at its peak. Actually, with a high frequency signal, the difference between these two methods are probably negligible, but with a low frequency signal, the difference can be enormous (several msec).
Hi Marty,
Y and G are the woofers the other colors are the mids and tweeters. The pulse frequency was a little different for the woofers vs the other drivers.
Y and G are the woofers the other colors are the mids and tweeters. The pulse frequency was a little different for the woofers vs the other drivers.
Pretty crowded graph here.
Doesn't tell me much about driver integration at your listening/measurement position. If your software allows for it, you could compute the resultant step responses and show those, one channel overlay each per graph to reduce complexity.
Then take measurements of each complete speaker at a time from the same position as during the previous mesurements, and show the computed step responses of left and right channels.
Should be interesting.
Regards, Marin
I don't know how to read or use the step graph..Step response is a much better graph for time domain.
See if these help?Pretty crowded graph here.
Doesn't tell me much about driver integration at your listening/measurement position. If your software allows for it, you could compute the resultant step responses and show those, one channel overlay each per graph to reduce complexity.
Then take measurements of each complete speaker at a time from the same position as during the previous mesurements, and show the computed step responses of left and right channels.
Should be interesting.
Regards, Marin
Attachments
Thank you for the plots, but still missing the step responses though.
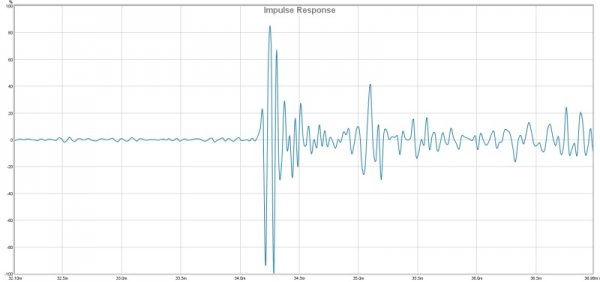
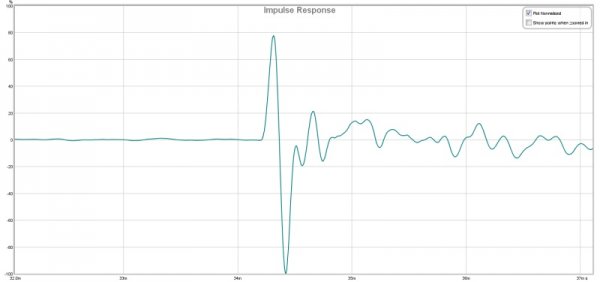
From my crude guesstimations, in the tweeter graphs there seems to be either a very early reflection or a strong diffraction from the baffle with a pathlength of about one foot more than the direct sound, shown by the first strong peak about 1ms after the initial impulse. I also feel that there is some ringing taking place at a frequency of about 18kHz (perhaps the tweeter diaphragm dome resonance).
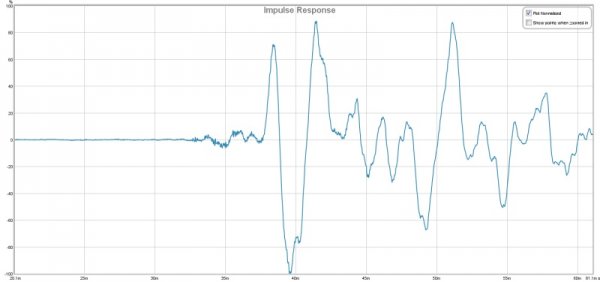
One woofer graph has extended scaling where I think I'm seeing some ringing with just below 400Hz.
Step responses would really help in seeing how this all integrates by showing how one driver's step blends into the next one's- John Atkinson's explanations about speaker measurements on stereophile.com are invaluable in understanding the different graphs and interpreting what can be seen there.
Not knowing anything about the room layout, speaker/measurement positions, measurement equipment, setup and used software, what I'm saying is to be taken with a large grain of salt...
Regards, Marin
From my crude guesstimations, in the tweeter graphs there seems to be either a very early reflection or a strong diffraction from the baffle with a pathlength of about one foot more than the direct sound, shown by the first strong peak about 1ms after the initial impulse. I also feel that there is some ringing taking place at a frequency of about 18kHz (perhaps the tweeter diaphragm dome resonance).
One woofer graph has extended scaling where I think I'm seeing some ringing with just below 400Hz.
Step responses would really help in seeing how this all integrates by showing how one driver's step blends into the next one's- John Atkinson's explanations about speaker measurements on stereophile.com are invaluable in understanding the different graphs and interpreting what can be seen there.
Not knowing anything about the room layout, speaker/measurement positions, measurement equipment, setup and used software, what I'm saying is to be taken with a large grain of salt...
Regards, Marin
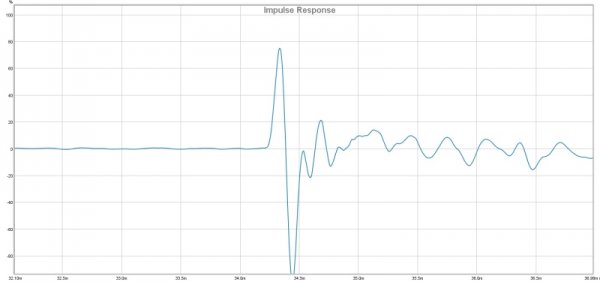
Here is an example of a very good step response for a dynamic cone speaker (YG sonja 1.3):

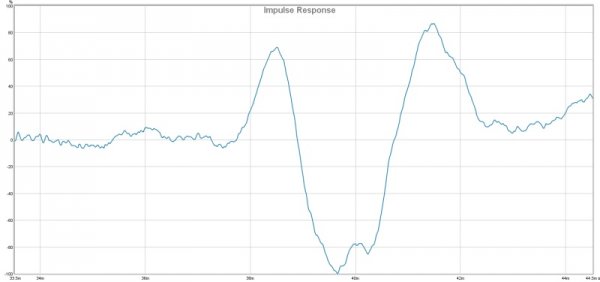
Here is a Quad step response. Probably the best Stereophile has ever measured:

Here is JA's article on ideal step response and how Stereophile measures speakers:
http://www.stereophile.com/content/measuring-loudspeakers-part-two-page-2
Here is a Quad step response. Probably the best Stereophile has ever measured:
Here is JA's article on ideal step response and how Stereophile measures speakers:
http://www.stereophile.com/content/measuring-loudspeakers-part-two-page-2
Just found an even older thread about Jay's adverture, pictures of the room with modified Klipschorns, insertion of a parametric eq, many adjustments, wildly differing graphs and all.
Horn speakers, and vintage ones especially, very often exhibit very rugged impulse/step responses, mainly due to the non-optimal structural layout of the horns themselves.
This doesn't mean, that what you hear isn't enjoyable!
Most recent horn designs by i.e. JBL show, that this can be avoided simply by applying modern measuring technology and proper understaning and application of the underlying physics. And their recent designs really do sound very good!
So, to get back to what I actually wanted to say, me interpreting measurements without relating them to what is involved physically, is like trying to read one's future from tossing chicken bones.
I should've known better and refrained from jumping to conclusions here, as well as clearly stating, that I'm just an ambitious hobbyist with almost 20 years of loudspeaker and room measurement experience.
I'm still curious about those step respose graphs, so work on them Jay!
Regards, Marin
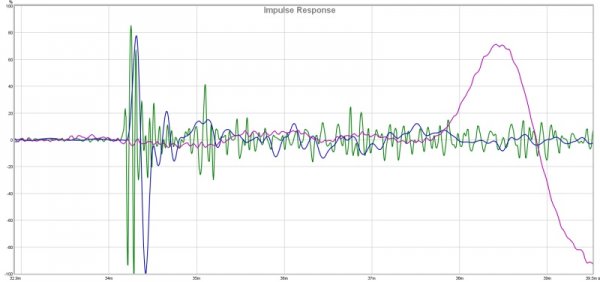
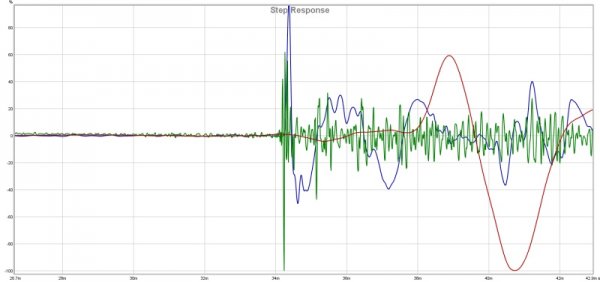
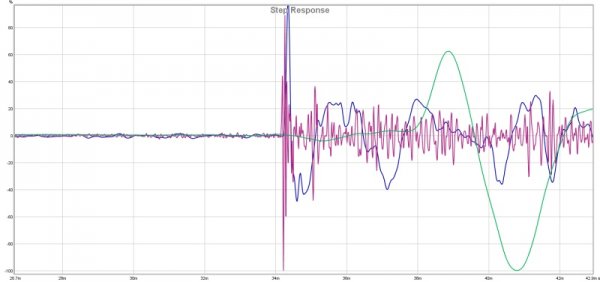
Ok first try at the step measurements.
Attachments
Last edited:
Ok first try at the step measurements.
I am not expert with REW. However, you may need to unload the other curves and also zoom in a lot more to the earlier part of the step.
I agree with Marin that there are many other measurements that are also helpful so you wouldn't want to worry too much about any single measurement. From what I can tell, it looks like the LF could use some help. Ideally, if the LF are under control, the decay blends nicely back into the 0 line on the x axis.
EDIT: did you take seperate step measurents for each driver? It would be better to take them all together in a single step measurement. That way, it's much easier to see how they all integrate.
Of course, one could shift the first arrival to the left and then zoom some more to get more detail...but we can also work with what we have here, I guess.
These graphs look like the individually taken driver step responses overlaid on one another.
I'm not sure wether Jay has stored measurements of each complete speaker, so we might have to give him some time to measure and compute the graphs...
I'm afraid, they are not going to look too pretty from what I see here, but let's keep our feet still, until we get the speaker system step responses.
Regards, Marin
Guys these are individual driver measurements, I will be taken more on Saturday. Can you tell what measurements will help to read? Then I can focus on that, just so that you know the speakers are totally modded. The started life as Klipschorns the mid drivers are upgraded to BMS 4592-mids this is a 2" driver connected to a 2" wooden tractrix horn. The tweeters are Fostex 90A's the woofers are orignal along with the cabinets, the xovers are custom built crossed at 400hz and 6000hz. I have to sealed subs running from 80hz down and the main run from 80hz up, hope this helps...
What I consider being helpful measurements when intending to eq a speaker in-room:
-Individual gated driver measurements in the nearfield (impulse, step, frequency response, waterfall), to figure out what their individual contributions are with as little room contribution as possible.
-Single ungated loudspeaker measurements from around the room (see above), to figure out the room contribution, finally concentrating more toward the listening position.
-Both speakers ungated from around the room concentating only on bass behaviour (see above).
-Both loudspeakers ungated at the listening position (see above), where special care must be taken to position the mic as precise as possible to perfectly align the first arrivals, as to prevent comb filtering effects which would render the treble range part of the graph meaningless.
Finally, while using the measurement program zoom functions and different smoothing and gating, I try to identify spots to eq, verifying each eq trial from that last measurement position, taking measurements of each single and both speakers. Listening to music excerpts inbetween gives me a handle on the success.
I have to mention also, that whatever one uses for eq purposes greatly affects, which measured aberrations can and should be fixed.
Does that sound conclusive for you? Comments?
Regards, Marin
Marin,
I have taken a large amount of measurements in the past 6 months trial and error, I have Eq'ed the room the sound quality is great from the listening position with one exception. There is a large amount of bass else where in the room other than the LP, all the measurements I have taken are from that position. If you go to Home Theater Shack Forum all the measurements are there in mdat format so you can adjust them to any parameter you like. Here http://www.hometheatershack.com/forums/rew-forum/88561-time-alignment-10.html go to post 92 for current setup and curves...
I have taken a large amount of measurements in the past 6 months trial and error, I have Eq'ed the room the sound quality is great from the listening position with one exception. There is a large amount of bass else where in the room other than the LP, all the measurements I have taken are from that position. If you go to Home Theater Shack Forum all the measurements are there in mdat format so you can adjust them to any parameter you like. Here http://www.hometheatershack.com/forums/rew-forum/88561-time-alignment-10.html go to post 92 for current setup and curves...
Jay,
I'm not using REW, so can't make use of the files, and anyway don't have as much time to burn as your comrades at HTS, who invest hours after hours to help you learn the software, interpreting the various graphs and optimizing your setup.
So far you and your friends seem to have addressed many issues.
But the problem of room interaction in the bass is one which can't be easily eq'ed.
If you can't, or don't want to radically change the room layout, equipment and speaker/listener position, there is nothing you can do to resolve the problem of good bass in only one small area of the room - that's all there is to it.
One last resort would be adding still more subwoofers, placing them at optimum positions and time-delaying/level-adjusting every single one of them individually to tame the standing waves, in order to even out bass response over a much larger area of the room.
Since I can't explain this easily and competently enough within a forum thread, I heartily recommend you get and read Floyd E. Toole's book "Sound Reproduction - Loudspeakers and Rooms", where he touches on this matter and much much more.
Sorry for not fixing your problems with a blink of my eye, and good luck with your journey.
Regards, Marin
No problem I can live with the way it sounds now easily, I was just trying to learn and improve if possible.
Similar threads
- Replies
- 19
- Views
- 1K
- Replies
- 2
- Views
- 972
- Replies
- 0
- Views
- 160
| Steve Williams Site Founder | Site Owner | Administrator | Ron Resnick Site Owner | Administrator | Julian (The Fixer) Website Build | Marketing Managersing |