For clarity, no pun intended, are you referring here to my High Shelf 5000hz, -1.5db filter?
Not directly, but if you don't think the sound was too bright to begin with, I would not add that.
I was referring to you saying that you would create a target filter based on the Harman curves. If we look at those curves / that graph, it's actually slightly confusing, and the difference between the different lines isn't as big as it may seem, as they are separated deliberately so you can tell the differences apart. The total shift between bass and treble is relatively similar in all, it's mainly the shape of the curve that is different.
1) Untrained listeners, total lift from 50hz to 10khz is around 9-10dB. But the lift is mainly from 100-150hz and up, what you'd typically get by employing a subwoofer and turning up the gain.
2) All listeners, basically an average between 1 and 3. More even curve, lift between 50hz to 10khz around 7d-8dB.
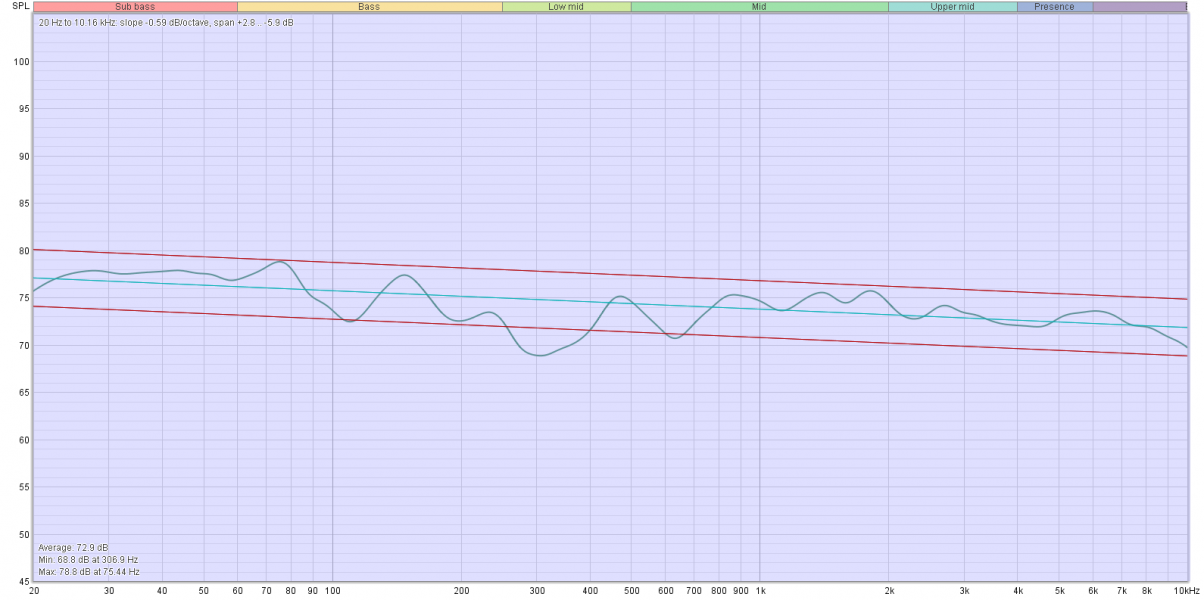
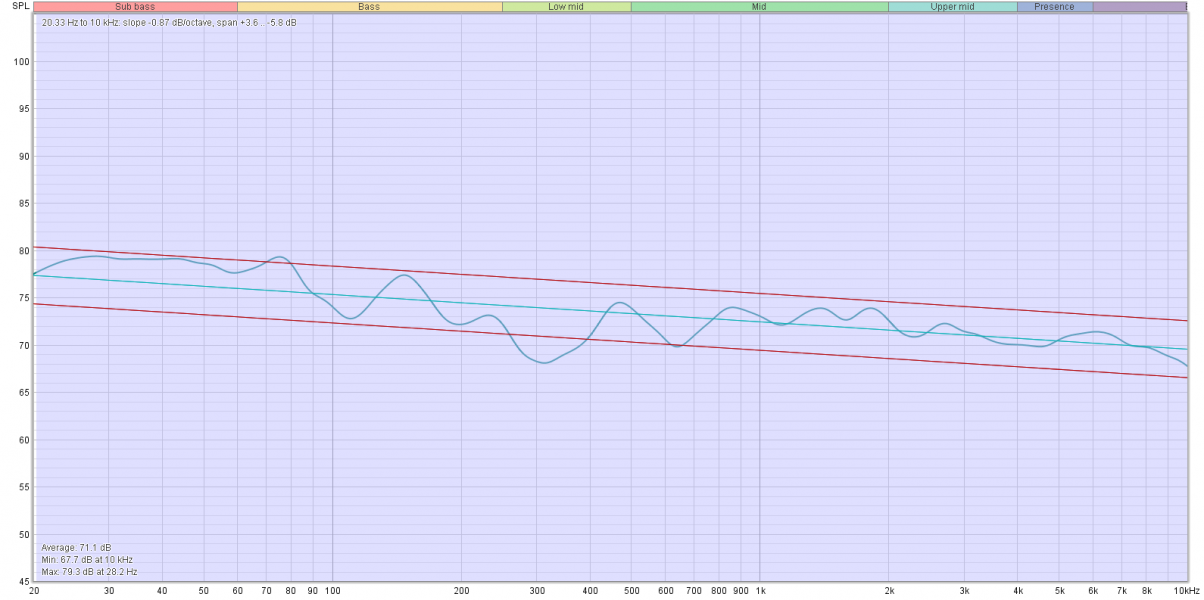
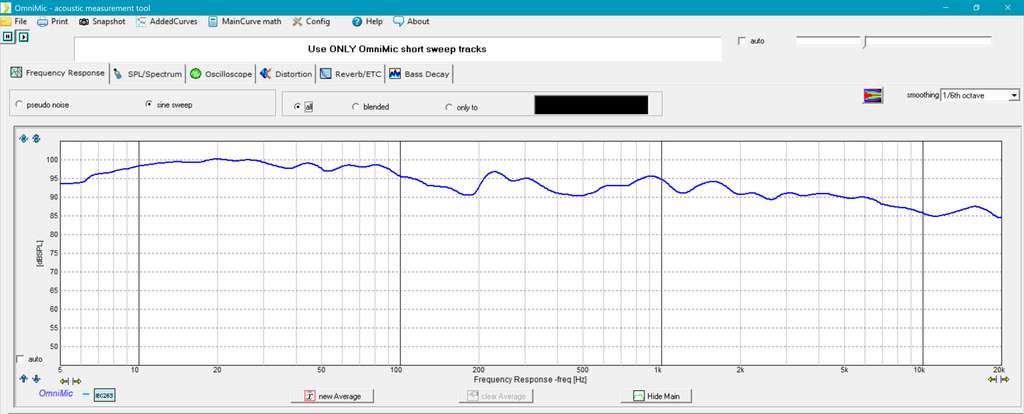
3) Trained listeners, total lift from 50hz to 10khz around 6-7dB. What's interesting about this curve is that it's very even, basically a gradual fall all the way. Incidentally relatively similar to my in-room response (posted on page 1)
For my comment to you, it's also worth noting specifically the thickest dotted line, which is predicted room curve for highly rated loudspeakers. Note how that is actually quite flat from 1-2khz and beyond. Finally note the shaded area indicating the difference in natural in-room lift depending on the room itself. And here different amounts of lift can sound natural in different rooms.
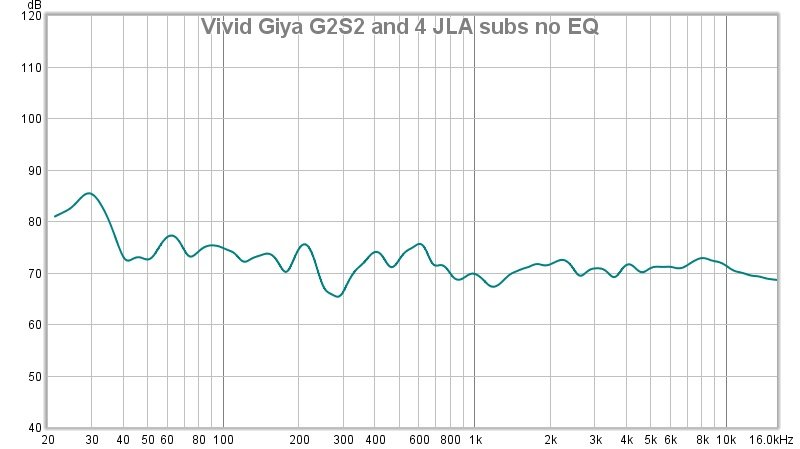
The point I'm trying to make about this last graph specifically is that the natural response of your probably quite competent speakers are relatively flat in the midrange/treble in your room. Unless you find the top end offensive / too bright, there's no sense in EQing that to match the Harman curve. That's not what the curve is trying to tell us.
Sorry if that was too long to follow, feel free to ask again and I'll try to clarify (hehe) again.


