DSD comparison to PCM.

Have you measured or listened to any proprietary FPGA converters?

Has Lynn measured or listened to anything except his own voice?
 
Haha, here's another one missing something. What trend do you refer to (or would like to see) ?
Well tbh it is a bit crude and may not show anything but may show some non-linearity, that is my caveat :)
Although to really see what is happening I feel the Julian Dunn/jitter spectra analysis type measurement is required (both John Atkinson and Paul Miller do this)
Ideally one would like to plot THD vs digital level for 1khz and either 15khz or 20khz (usually more ideal for CD-PCM analysis) and another separate test A-weighted S/N Ratio magnitude against octave band - this test analysis is done by Paul Miller.
Also I understand John Atkinson likes to use intermodulation distortion test (19khz+20khz) and this does sometimes throw up some interesting results.

Cheers
Orb
 
Has Lynn measured or listened to anything except his own voice?

Hi Jim and good morning to all. Let's try to keep ad hominem attacks out of the morning posts please as they serve no useful purpose. Enjoy the rest of the day
 
Well tbh it is a bit crude and may not show anything

But Orb, I don't see where this is relevant. I mean, although I may use it as some reference here and there, this isn't about the NOS1, or ?
So before it is taken wrongly, my first graph was about how someone like me likes a straight noise line as a prerequisite and the second was in response to how averaging makes things look better.
Now, supposed this was about PCM vs DSD and I could show plots of both for comparison and further discussion ... but I can't because then first I must have DSD going in the way I want it, and that is not the case. I wish it were.

I have thought about putting up some dirac pulses (these are pulses to the plus side only of one sample "width") which are sort of relevant to DSD which always still rings more, but firstly I thought it would be self-advertising and secondly such graphs don't come on their own. I mean, I can show those pulses which are 100% followed in analog (27KHz IIRC) but any pulse with infinite rise time (that's what it is) implies for infinite frequency and next we would be (no should be) in further analysis of the frequency band and what would happen with these infinite frequencies while actually we (still) talk about 16/44.1, though upsampled to 24/705.6 which right away makes them 16 samples long. Next I still can show these perfect pulses but captured by an SDM (of the analyser) which is 24/192 only and now nobody will understand what we're actually looking at. Could still be interesting for the thread, but IMHO not without doing the same for SSD which I can't.
And lastly, I never ever put out theoretical graphs (SPICEd let's say) because practice works out differently anyway. Take my analog-dither example from the earlier post ...

Regards,
Peter
 
@Lynn

All related to the subject for sure, Lynn, I hope you saw my (forum) PM to you from yesterday and I don't want to be intrusive, but I sure hope you can help me out.
Btw, no secrets or anything, but just not for the forum I think.

Thanks !
Peter
 
One other thing and FWIW :
I really think DSD can be all over way better than PCM. But similar to how with PCM I apply a couple of tricks (well, that filtering), with DSD I need to be as ignorant and obviously with the data (music) which is availably around.
As said, FWIW.
 
Have you measured or listened to any proprietary FPGA converters?

FPGAs make good platforms for proprietary digital algorithms, but because of all the internally generated substrate noise are not useful for the analog portion of the conversion; that must be done externally with devices on a separate substrate. In the AD1955 dac, ADI isolates the current switches which perform the conversion to the 'analog' signal in a separate well with its own substrate ground pin. Bob Adams told me once that they spent a lot of time on this isolation problem to get that chip's level of performance.

LynnOlson said:
No, I haven't. I'm curious about the technology: I assume deglitching is non-trivial, and requires a well-designed sample-and-hold following the converter.

With careful design, a simple one bit converter for DSD could be done - a single DMOS switch with glitch cancellation. For a multi-bit converter it's something of a nightmare, because the glitch energy depends on the number of actual current switches changed for each sample - and which ones follow which others! That's why Burr Brown forgo the degliching in favor of low glitch energy. Even so, that still represents much of the error in both of their respected NOS dacs.

Sample and hold's add their own coloration, even if their glitch energy is cancelled.
 
But Orb, I don't see where this is relevant. I mean, although I may use it as some reference here and there, this isn't about the NOS1, or ?
So before it is taken wrongly, my first graph was about how someone like me likes a straight noise line as a prerequisite and the second was in response to how averaging makes things look better.
Now, supposed this was about PCM vs DSD and I could show plots of both for comparison and further discussion ... but I can't because then first I must have DSD going in the way I want it, and that is not the case. I wish it were.

I have thought about putting up some dirac pulses (these are pulses to the plus side only of one sample "width") which are sort of relevant to DSD which always still rings more, but firstly I thought it would be self-advertising and secondly such graphs don't come on their own. I mean, I can show those pulses which are 100% followed in analog (27KHz IIRC) but any pulse with infinite rise time (that's what it is) implies for infinite frequency and next we would be (no should be) in further analysis of the frequency band and what would happen with these infinite frequencies while actually we (still) talk about 16/44.1, though upsampled to 24/705.6 which right away makes them 16 samples long. Next I still can show these perfect pulses but captured by an SDM (of the analyser) which is 24/192 only and now nobody will understand what we're actually looking at. Could still be interesting for the thread, but IMHO not without doing the same for SSD which I can't.
And lastly, I never ever put out theoretical graphs (SPICEd let's say) because practice works out differently anyway. Take my analog-dither example from the earlier post ...

Regards,
Peter
Peter I was not being critical so apologies if it looks like that.
The test may be worth doing because it shows the nature and implementation of the chip-architecture-output stage and what might be achievable, this is outside of PCM vs DSD and more about bit resolution,actual noise etc to signal,etc.
Appreciate what you are trying to show, just putting into context for some who felt it may represent the actual noise floor of what is produced.

Cheers
Orb
 
The hidden sneaky part of all delta-sigma converters is that the actual conversion does have an element in it that needs to have full precision. In the ADC it's the input differencing (delta) block; in a DAC it's the output. Nonlinearity in the 1-bit bit stream, i.e. not going to a perfect 1 and 0, can cause distortion.

On noise floor: There is a description in one of my tutorial threads in the Tech Talk Forum, but the simple answer is that while SNR goes as 6N for N bits (based on quantization noise only), the noise floor goes as 9N. Thus an ideal 20-bit converter would have about 120 dB SNR but a spectral plot would show a noise floor of about 180 dB (given enough points so the FFT does not limit the floor). One way to think about it is that all the noise across the bandwidth gets "added up" to generate that total SNR figure; each individual contributor must thus be much smaller than the final total.

My experience designing DS ADCs and DACs matches Peter's -- the reality rarely resembles the simulation. Disclaimer: My work is in the GHz region, not audio, though the converters had to work to DC (radar systems are a bear).
 
All related to the subject for sure, Lynn, I hope you saw my (forum) PM to you from yesterday and I don't want to be intrusive, but I sure hope you can help me out.
Btw, no secrets or anything, but just not for the forum I think.

Thanks !
Peter

PM sent, hope it's useful. Since there are well-respected industry professionals in this thread, I'll throw out a few comments aimed at them. Having worked at Tek for nine years, I'd avoid old Tek or HP instruments (both scopes and spectrum analyzers). They have key parts that are no longer in production, and repairing and calibrating these things is not easy. The field-calibration section of the Tek 492 manual is 200 pages long and requires HP benchtop instruments to perform the procedures. (I wrote the procedures for the similar Tek 494 instrument. Trust me, you have to know exactly how the analyzer works to write a calibration procedure.)

I've been told by a forum member there are modern spectrum analyzers that go out to 3 GHz; if they are too expensive to buy, they can be rented for a month or two. The primary application for a RF spectrum analyzer in the digital world is direct measurement of the spectrum coming out of the converter (paying attention to load impedances) and direct measurement of phase noise (jitter) from the clocks. Long-term drift of the clocks is not that important for audio, but close-in phase noise is extremely important. By "close-in" I mean sidebands that are 10 Hz to 10 kHz wide, with particular attention to power-supply artifacts (100 or 120 Hz harmonics visible through the noise). With an instrument that can display 80 dB or 100 dB on-screen, you can see all sorts of interesting artifacts, and better yet, correct them.

The reason I mention renting instead of buying is that a RF spectrum analyzer is mostly a debugging tool; once you know what the converter is spitting out, you don't need to measure it again, and cleaning up phase noise on the clock generators should go pretty quickly.
 
Hi Jim and good morning to all. Let's try to keep ad hominem attacks out of the morning posts please as they serve no useful purpose. Enjoy the rest of the day

Sorry, did not mean to offend anyone. But it seems, some have an agenda. I might like blondes, and someone else brunettes or redheads. To each his own. But let me be clear on this, there is no right or better way.
 
I should add that the Tek 492/494 and HP 3585A RF spectrum analyzers of 1985 to 1990 were very expensive, around US$40,000 to US$45,000 each, several times the price of the Audio Precision audio distortion analyzer (which was also a Tek spinoff). Tek, and I think HP, have gotten out of the business, due to competition from Japan and Taiwan. The Asian instruments might be as cheap as $5000, which would make them a good buy if the specs are adequate (80 dB and 100 MHz minimum).

Returning to measuring phase noise in the clock circuits, I'm sure this part is obvious, but you'd start at the source clock, measure and correct that, then go through the circuit as the clock signal progresses towards the converter. I would feel uneasy using indirect methods down in the audio band; it seems like it would be much harder to debug and isolate the source of the phase noise, since you're looking at the system as a whole.

The raw converter output is a one-shot measurement: feed digital full-modulation at 20 kHz in, and look at the spectra coming out of the converter. That'll tell you how much (linear) bandwidth the I/V converter needs to have.

MarinJim, if you'd like to see measurements, there's lots at:
http://www.nutshellhifi.com/frqresp.gif
http://www.nutshellhifi.com/wtrfall6.gif
http://www.nutshellhifi.com/wtrfall2.gif
http://www.nutshellhifi.com/library/FindingCG.html
http://www.nutshellhifi.com/library/ETF2.html
 
Last edited:
I don't know how the used market is for spectrum analyzers (SAs) now. I have used units that go to well over 100 GHz but they do not reach the audio band,and they cost $250k - $500k full configured. A few years ago we found the system DSP's noise leaking into the RF front end was adding noise spurs and hurting headroom (this was a 140 dB dynamic range sort of thing). It was very hard to find and eliminate. I'd guess the 40 GHz model I use at work now is around $200k... These are Agilent (formerly HP) and they are certainly not out of that business. R&S, Avantech, Wilson, many others make good SAs. I am not sure Tek was ever really in the SA business...

My guess is you really need a good audio analyzer for most of the real audio work, and a low-end'ish RF SA to check for things like RFI sensitivity, oscillating stages, clock coupling, etc. You don't need maximum performance for that so a low-end SA is good enough. A basic Agilent 3 GHz SA (N9320B) is about $10k brand new, and you can find older used units for maybe $3k - $5k.
 
The Tek 492 and 494 were sold almost entirely into the military market, since they were the only units at the time that were portable and made-spec under battlefield conditions (they were used by the Brits on helicopters during the Falklands war). Also popular for calibrating radar sets on the DEW line in the far north; we heard some entertaining stories from the field reps.

Glad to hear Agilent is still around, and making a suitable unit at a reasonable price.
 
Forgot abut those Tek SAs; they have had other products through the years but AFAIK never really made significant inroads into that business. Although I have not looked at anything other than their DSOs for a while (we have several 50 GHz models in our lab, plus a few Agilents just to keep both companies honest ;) ). Agilent also makes filed SAs now, and an audio analyzer; pricey little bugger. I am a little surprised they keep it in the line since AP seems to have taken over that end of the business.
 
FPGAs make good platforms for proprietary digital algorithms, but because of all the internally generated substrate noise are not useful for the analog portion of the conversion; that must be done externally with devices on a separate substrate. In the AD1955 dac, ADI isolates the current switches which perform the conversion to the 'analog' signal in a separate well with its own substrate ground pin. Bob Adams told me once that they spent a lot of time on this isolation problem to get that chip's level of performance.


With careful design, a simple one bit converter for DSD could be done - a single DMOS switch with glitch cancellation. For a multi-bit converter it's something of a nightmare, because the glitch energy depends on the number of actual current switches changed for each sample - and which ones follow which others! That's why Burr Brown forgo the degliching in favor of low glitch energy. Even so, that still represents much of the error in both of their respected NOS dacs.

Sample and hold's add their own coloration, even if their glitch energy is cancelled.
Hmm I thought Chord Electronics has all the functionality on their FPGA architecture; S/PDIF communication/RAM 4sec buffer/proprietary filter (cannot be impulse response tested - very nifty trick)/and their DAC.
Need to think back if I can remember any others, guess I need to check Xilinx papers-spec for their OEM product some may use.
Cheers
Orb
 
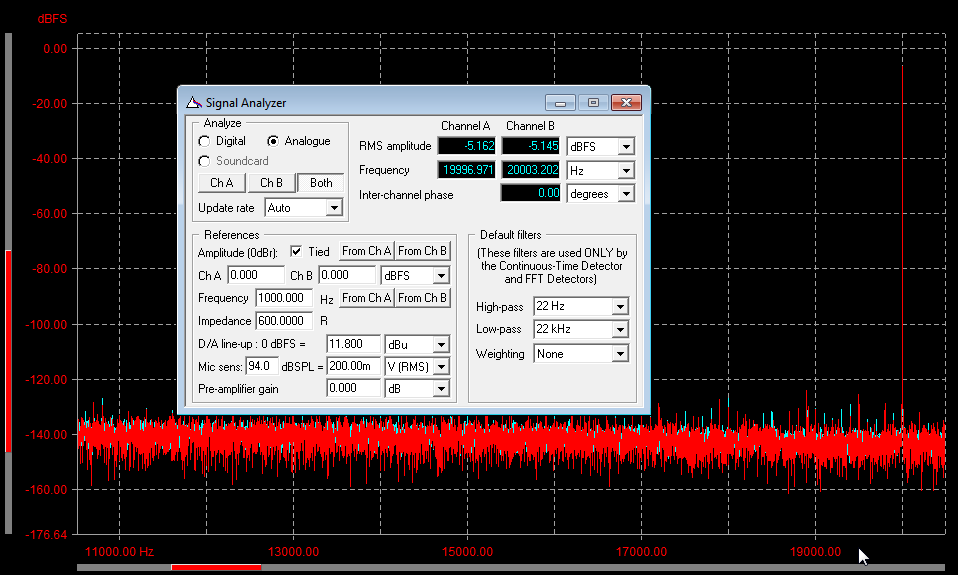
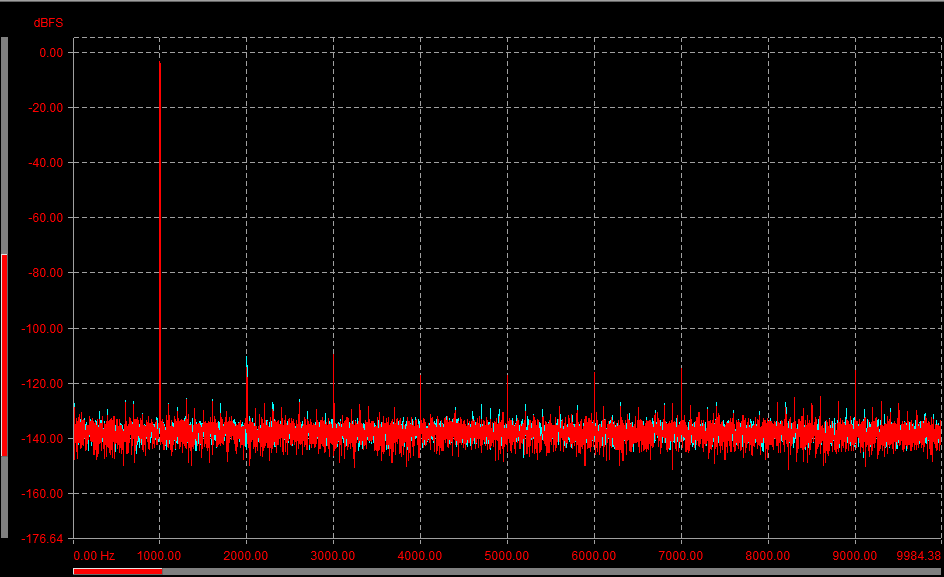
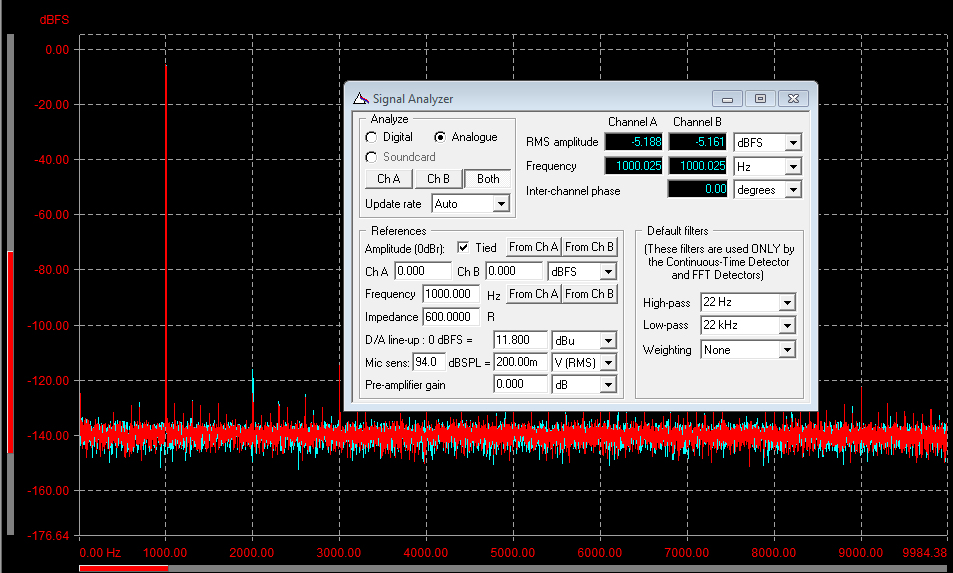
Speaking of measurements, Peter, do you have any spectrum displays of your DAC with a 1, 5 or 20 kHz digital input? Curious how your I/V converter performs. The noise-floor measurements are superb, but I'm curious what it does in the presence of signal.
 
Plots

All right (and also addressed to Orb of course). Please notice that at this time I can only use what I have been posting elsewhere (not that I rent my analyser, but it just takes time to measure, document what I did with what picture etc.).

Shots will be from the 384 version with the notice that the I/V changed for the 768 version (only for the better).

FFT 256K 0-10K.png

1KHz@-3dBFS. 4 times averaged, FFT=256K.


OutputLevel 1000Hz.png

1KHz@-3dBFS. 4 times averaged, FFT=256K.
Same as above but signal is attenuated another 2dBFS and to compare with the below :


OutputLevel 20000Hz.png

20KHz@-3dBFS. Should be 4 times averaged (but looks less), FFT=256K
The extra 2dBFS of attenuaton comes from (HDCD's) Peak Extension and was used here to prevent possible overshoots in the electrical domain (notice that 20KHz is rather steep :p).

Now, where is that roll off ?


The base of it you see here :

Idle Noise XLR-a.png


Around 2uV of the ~ 8uV is caused by the I/V.
Notice that the DAC is just running and there is only no signal pushed through.

Now, I'd really like to make this more interesting for us all, but I need to find the pictures.
Ok, one more which is important for real merits :

Pulse Arc Prediction (XXHE) 44.1 176.4.png


So, this is the impulse response going along with the FFTs. Notice this is a 16/44.1 dirac pulse (which is plus only to full scale (well, -3dBFS again)) and upsampling is 4x only here (which is more difficult than the usual 16x because more steep). Remember, all measured at the analog outs (XLR).
The importance of this is that now the FFTs are 100% real. So, because this is as NOS as NOS can be (because a no-ringing filter) the normally presented plots from DACs with a SDM D/A will show better plots on the FFT (and THD+N for that matter) but they won't incorporate the ringing which is necessary to obtain the good figures from the periodic signal. This is how music as such won't represent those good figures. Here it does, because there will be no difference between music and the periodic signal. So, whatever THD shows, the same "THD" applies when music plays. A prerequisite for this to happen is that the I/V must be fast enough (the slewing thing and I hope to show that with other pictures later - well, if this is not overdoing things already :eek:).


PS for Orb : I don't think I ever stored IM plots somewhere, so I really have to make them, incuding a good signal which is a skill on its own (and with the notice that I can't use any pre-cooked sigital waveform generation from the analyser because it can't output digital to the digital input I use).
 
Heya Peter,
well tbh I am not sure how to correlate the IM plots to audible effects, I appreciate it is something John Atkinson does as it provides a great stress test but I know Paul Miller does not bother with it.
Thanks for taking time doing more plots as well :)
Cheers
Orb
 
Plots 2

FWIW I found these two plots which came from the last dirac plot :
(it almost starts to look like DSD plots :D)

Pulse 44_1 192 Anti Image (SoX) FFT.png


Notice the dirac pulse in this case occurred at a ~1KHz frequency.
Keep in mind that any infinitely rising signal (which dirac is) implies all the frequencies in the world.
And for the real insiders : that this is captured with a 24/192 A/D.

What you see above is a "normal" filter as it will be applied in about all modern (SDM) DACs. This one is FIR. Upsampling is from 16/44.1 to 24/192.
You can nicely see how beyond the audio band all is filtered out. Well, with 80dB.


Pulse 44_1 176_4 Arc Prediction (XXHE) FFT.png


This is the same, but now with our non-ringing filter (Arc Prediction) and in this case upsampled to 24/176 (A.P. can only do even numbers).
You could say the roll off is natural now, but notice (or try to see) that any frequency very close to the Nyquist mirror (22.05KHz) is 3dB down compared to the original signal at the other side (in-band). See the "algorithm" applied, when going to 2x fs/2 = 44.1KHz and that there the roll off is optimal (no energy and noise floor). What you can't see much when not knowing it, is that where this frequency close to the Nyquist mirror will be at -3dB a bit further off it's already -6dB etc. Read this as : between 44.1 and 22.05 = 44.1 - 11.025 = 33.075 = down at 140dB / 2 = 70dB which makes a signal like 22.05 - 11.025 = 11.025 have an energy behind the mirror of that -70dB. Extrapolating further something like 16KHz will be at -35dB at the other side. Look at the plot and you just see that happening.

Is that bad ? I always say no. However *theoretically* it depends on the bandwidth of the amplifier and the more bandwidth the worse it could be for speakers (again theoretically) and the less the bandwidth of the amp the less of a problem for a speaker, but the more distortion the amp itself may show. May.

Now DSD. As far as I can see this exhibits "noise" at 100KHz and beyond at -0dB. The further difference : not correlated to the music (frequencies). They say. Btw, I tried to find a real life graph of that but coudn't find one quickly.
 

About us

  • What’s Best Forum is THE forum for high end audio, product reviews, advice and sharing experiences on the best of everything else. This is THE place where audiophiles and audio companies discuss vintage, contemporary and new audio products, music servers, music streamers, computer audio, digital-to-analog converters, turntables, phono stages, cartridges, reel-to-reel tape machines, speakers, headphones and tube and solid-state amplification. Founded in 2010 What’s Best Forum invites intelligent and courteous people of all interests and backgrounds to describe and discuss the best of everything. From beginners to life-long hobbyists to industry professionals, we enjoy learning about new things and meeting new people, and participating in spirited debates.

Quick Navigation

User Menu