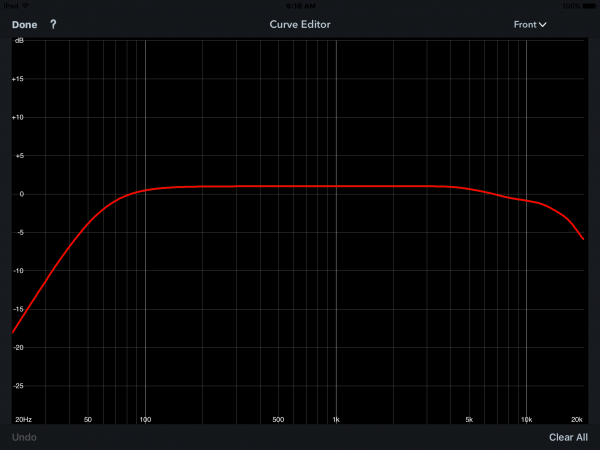
Yes, thanks for the file, Ray. It looks pretty much like the one for my ECM-8000, as well as other ECMs I’ve seen.
Fitz, do you have any other mics to reference for us? When you said the measurement-mic calibration curves you’d seen were virtually the same for 0° and 90° I was hoping you had info on some of the more uncommon mics we don’t see much of, like Earthworks, dbx, etc.
As it is, with the UMIK, ECM8000 and similar mics, I just can’t hang with the idea that a deviation between the two of 5 dB or more @ 12 kHz is of no consequence, so I’m sticking with my previous statements.
A case in point, there’s a guy at HT Shack who posted measurements from his room with 0° and 90° measurements, each with the appropriate calibration file in place, and got noticeably different results in the high frequencies. The graphs are below. He claimed to be using a USB mic from Cross Spectrum, although I’m not sure which one (probably a UMIK-1 or Dayton UMM-6). Note that the 90° measurement does not show the “droop” in response above 2 kHz that the 0° graph does, which most assuredly shows the how ceiling reflections can be artificially boosted by the 90° calibration file. When I questioned him as to which he felt was the better representation of what he was actually hearing, he picked the 0° graph, saying he felt the highs from his speakers were on the “soft” side.
I won’t say this is a common occurrence – I honestly don’t know if it is or not, but the fact is, it can indeed happen. That’s why I like to stay with 0° measurements. There’s no “maybe” with them, you know what you’re getting.


Regards,
Wayne A. Pflughaupt


