"A Spectral Analysis of Analog and Digital Recordings
Analysis: To analyze the two audio samples, analyzing software called SpectraFoo was used. According to the manual obtained from its host website, Metric Halo (2011), SpectraFoo can be described as a “high–precision, low–latency, fully realtime audio visualization and analysis system”. SpectraFoo converts an audio signal into a visual representation of the signal. For this particular analysis, the spectragraph option was used. The spectragraph is an “ultra high resolution real-time two channel spectrum analyzer with snapshots, cursors and overlays” (Metric Halo, 2011, p. 18). The spectragraph takes the audio signal and presents it in a comparative waveform between two channels. In this study, two separate comparisons were made between the digital left and analog left, and the digital right and analog right mix channels respectively. The decision to use the final mix channels rather than the individual instrument channels was to ensure that the comparison accounted for waveform interaction between individual instrument channels as the final mix was constructed.
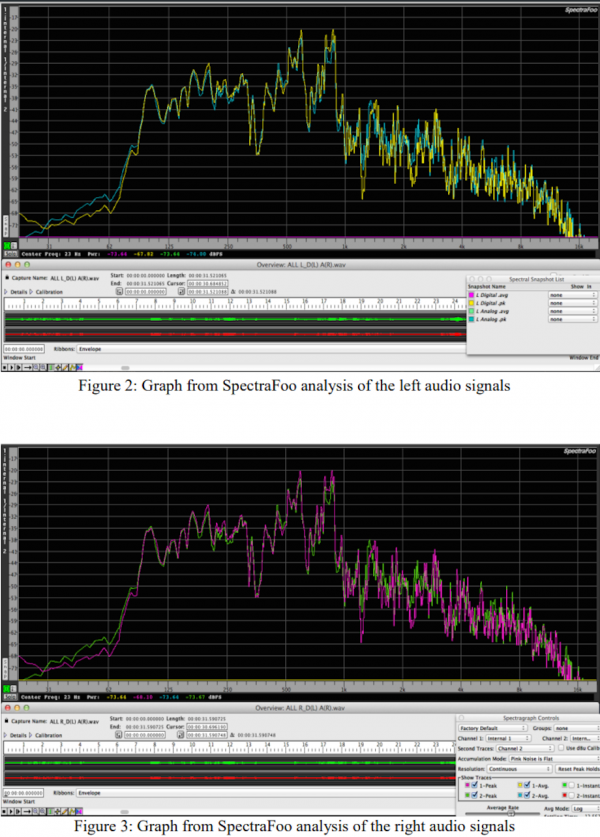
Figure 2 represents a comparison of digital and analog left-channel signals. The yellow waveform represents the digital signal and the blue waveform represents the analog signal. Since both signals were obtained simultaneously with no difference in signal flow (except for digitizing the analog signal for comparison), the signals should be similar, if not exact replicas of one another. However, that is not the case. The signals share broad similarities, but there are many discrepancies. For example, around the 800Hz mark, the analog signal is noticeably lower than the digital signal. The same can be concluded about the right side, which is displayed in Figure 3. In Figure 3, the pink line represents the digital signal and the green line represents the analog signal. Both graphs show a similar trend in which the differences grow greater and more frequent at higher frequencies. Starting at about 800Hz, the contrasts between the two signals become more prominent. This development is evident in both the left and right signals. The midrange frequencies from around 250Hz to 650Hz seem to be the most similar when looking at the comparison. It is also important to note the harshness of the peaks and valleys in the digital signal. When looking at the amplitude of the two signals, compared to the analog, the digital seems to produce a wider range of peaks and valleys. These differences could have a small sonic impact of the overall “sound” of the music, which may or may not be perceivable depending on the listener’s ability to listen critically. This may be a contributing factor as to why some prefer one to the other in terms of how it sounds.
Differences between the analog and digital signals are noticeable. Although these variances may not necessarily be noticeable to the untrained ear, they are clearly evident when examining the audio in a visual form as seen in Figures 2 and 3. The contrasts seen in the graphs are a result of the differences in the two technologies. Though exact causes remain unexplainable, the waveform data confirms that differences in recording technology (digital and analog) can impact the signal, and perhaps, the way we perceive and subsequently assess a musical recording."


