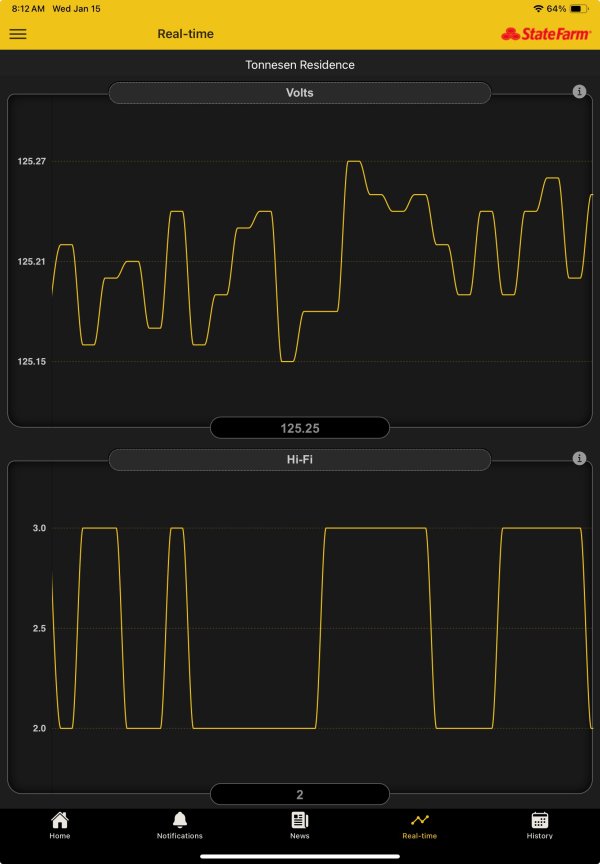
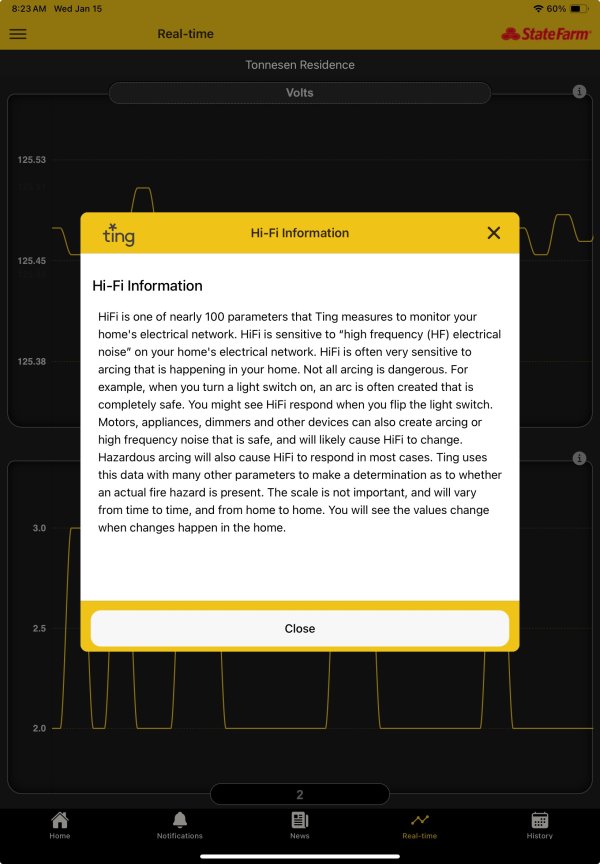
I've posted in other threads my weekly Ting summary of power quality. Ting is a monitor that my insurance company provides to monitor fire risk in my home electrical wiring. I'm exploring if it is useful for monitoring power quality for my stereo system. In addition to the weekly summary of daily plots, the app has a real time display that shows voltage and high frequency (Hi-Fi) noise for the previous 30 seconds. Images below show one 30 second plot and a text box explaining Hi-Fi noise.
I can use this to see changes in voltage and noise in real time as I turn on and off different appliances. If I power down all the appliances in my house, I assume this gives me an estimate of how much voltage variability and noise there is in the power supply from my utility company. I didn't see any change in variability in the 30 second real time plot when my solar panels started generating power this morning (this is a cloud free day, so I need to check again when the solar output is more variable because of clouds). In the daily plots there is a diurnal cycle in the voltage peaking in the daytime when the panels are generating power.
Ting also measures total harmonic distortion and their website rates different utility companies for THD. They don't explain how they calculate THD and I don't have access to a THD estimate for my home. They say I will be notified if my home THD increases "beyond the industry standard for acceptable limits". Ting also reports alerts for brownouts, community power outages and can detect lightning activity and has been used to estimate area where power lines might have caused fires.
Is anyone else using a Ting monitor? It might be more helpful if I could get the real time estimates of THD in my home.


