Thanks for posting the graphs, Amir
Just a question - what do you think an eye pattern shows & how do you interpret it's acceptability "in this context"?
My understanding of these eye patterns - what you are seeing in these graphs is a repeated overlay of the scope trace of the waveform.
If there was no jitter each scope trace would exactly overlay the previous scope trace & the lines on the graph would be very thin
With timing differences (jitter) between the waveforms the overlays make lines appear wider in the graph.
The idea of an eye pattern is that USB compliance has a maximum allowable amount of jitter (jitter budget) which will not cause data errors
The eye pattern graph is a diagrammatic representation of this allowable jitter budget - the idea being that at a certain point of closure of the eye the compliance fails. There is a template to overlay on these eye graphs that can be calculated & allows one to judge if compliance is reached or not
But this is about compliance. Are there any guidelines about changes in this jitter pattern Vs audibility? Can changes in this jitter be written off so non-chalantly as irrelevant to audibility?
Remember also that the eye pattern is not showing the spectrum of the jitter just a feel for the overall level of it
Some further information about rise/fall time compliance in USB from here
"There has always been a problem accurately measuring rise and fall times, especially on high speed devices. The measurement of interest is the edge rate, or slew rate, during the state change time. To help improve accuracy of the measurement, the USB-IF is standardizing on one test fixture for high-speed signal quality.
Aside from the fixturing and probes used to take the measurements, major contributors to the inaccuracies in these measurements are the shape of the edge, noise on the signal and the method of calculating the 10% and 90% points as defined in Sections 7.1.2.1 and 7.1.2.2 of the USB 2.0 Specification.
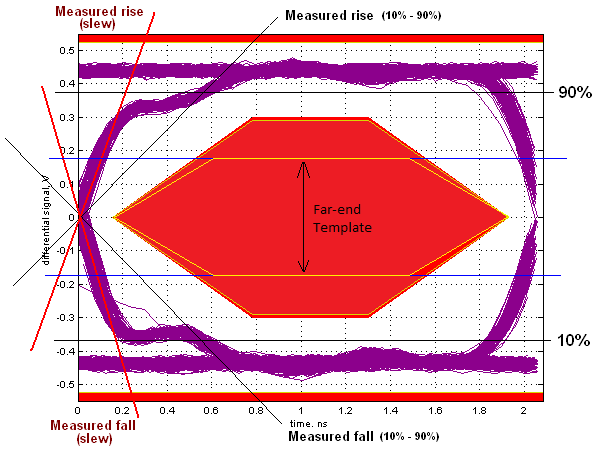
A waveform with slow corners (see sample eye diagram below) will result in a measured rise time that is slower than the actual edge rate would indicate. Also a small change in the position of the 10% and 90% points due to noise on the signal, etc., can cause a relatively large change in the measured rise time. "

"The relaxed edge rate values of 300ps and 100ps apply for high-speed USB signaling"
As I said before - is eye pattern a good measurement for correlation with audibility? I think someone answered yes & used the JA measurements as evidence but I need to look into this further
Just a question - what do you think an eye pattern shows & how do you interpret it's acceptability "in this context"?
My understanding of these eye patterns - what you are seeing in these graphs is a repeated overlay of the scope trace of the waveform.
If there was no jitter each scope trace would exactly overlay the previous scope trace & the lines on the graph would be very thin
With timing differences (jitter) between the waveforms the overlays make lines appear wider in the graph.
The idea of an eye pattern is that USB compliance has a maximum allowable amount of jitter (jitter budget) which will not cause data errors
The eye pattern graph is a diagrammatic representation of this allowable jitter budget - the idea being that at a certain point of closure of the eye the compliance fails. There is a template to overlay on these eye graphs that can be calculated & allows one to judge if compliance is reached or not
But this is about compliance. Are there any guidelines about changes in this jitter pattern Vs audibility? Can changes in this jitter be written off so non-chalantly as irrelevant to audibility?
Remember also that the eye pattern is not showing the spectrum of the jitter just a feel for the overall level of it
Some further information about rise/fall time compliance in USB from here
"There has always been a problem accurately measuring rise and fall times, especially on high speed devices. The measurement of interest is the edge rate, or slew rate, during the state change time. To help improve accuracy of the measurement, the USB-IF is standardizing on one test fixture for high-speed signal quality.
Aside from the fixturing and probes used to take the measurements, major contributors to the inaccuracies in these measurements are the shape of the edge, noise on the signal and the method of calculating the 10% and 90% points as defined in Sections 7.1.2.1 and 7.1.2.2 of the USB 2.0 Specification.
A waveform with slow corners (see sample eye diagram below) will result in a measured rise time that is slower than the actual edge rate would indicate. Also a small change in the position of the 10% and 90% points due to noise on the signal, etc., can cause a relatively large change in the measured rise time. "

"The relaxed edge rate values of 300ps and 100ps apply for high-speed USB signaling"
As I said before - is eye pattern a good measurement for correlation with audibility? I think someone answered yes & used the JA measurements as evidence but I need to look into this further
Last edited:


