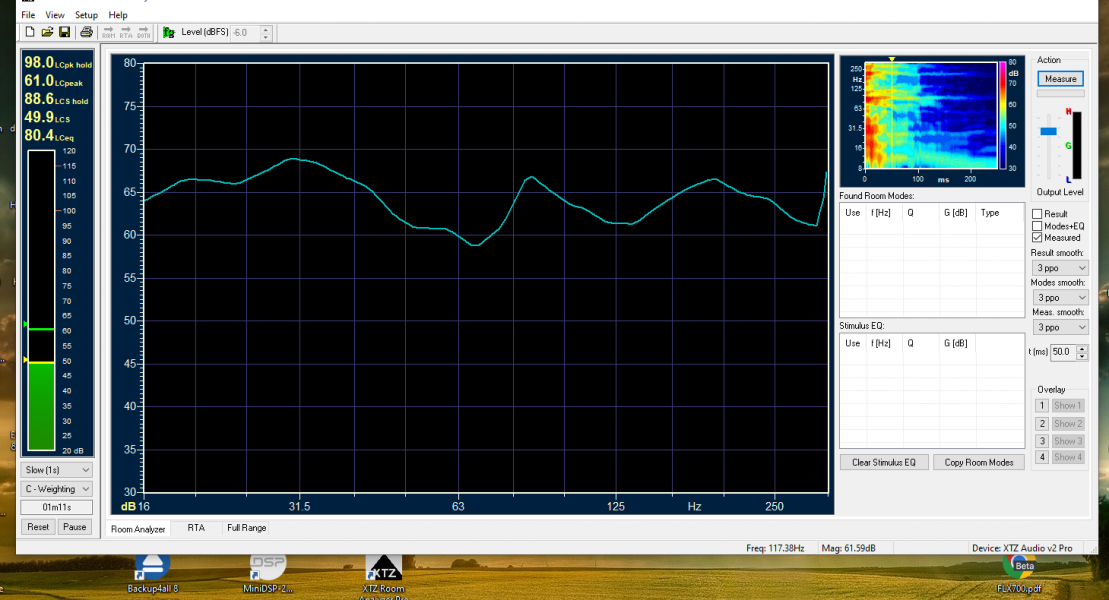
Okay another one , this one is 1/2 octave smoothed and measured on tweeter axxis at 1 meter distance .
If i want to have more down slope , i measure ( or listen ) of tweeter axxis .
FYI the below graph is almost +- 1 db over a 650 - 20 khz range , not bad in my view
Where you put the mic is extremely important to have a beauty graph .
15 cm higher and measured at 2 meters will give a different graph

If i want to have more down slope , i measure ( or listen ) of tweeter axxis .
FYI the below graph is almost +- 1 db over a 650 - 20 khz range , not bad in my view
Where you put the mic is extremely important to have a beauty graph .
15 cm higher and measured at 2 meters will give a different graph
Last edited: