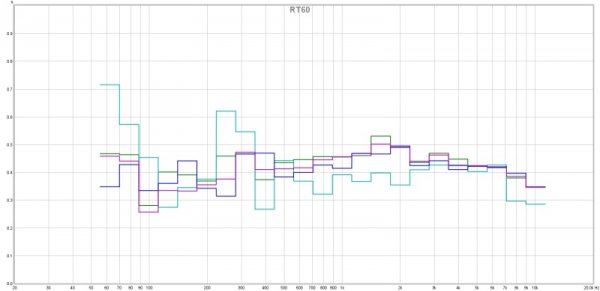
For small room acoustics (i.e. all the rooms we are talking about) there is no reason to search for any specific shape or flat response. The technical reason is that a "Reverberant field" will not be generated in such small space. In English

, we are looking for a gross measure of "late reflections" in the room. Late reflections determine how live or dead a room is. A room that is too dead is uncomfortable for humans to live in as we are used to reflections existing in everyday life so removal of them to high degree feels unnatural and uncomfortable. Too live of a room interferes with clarify of music and dialog. To use RT60 to measure the extent of late reflections, you want to look at just one frequency: 500 Hz. In that region as Bruce mentioned, you want to strive for a number between 0.3 and 0.5. Values below 0.3 indicate the room is becoming too dead, above 0.5 means too live. The former means you have too much general absorption and the latter, too little.
Late reflections are impacted by anything in the room from acoustic products to furnishings. If you have a well furnished room, you may not need any absorption to decay them as this step by step measurement from Dr. Toole shows:
(...)
Note how the survey of 600 homes by J Bradley showed that normal living rooms fortuitously fall in the target range. We may not know about audio but we do know what sounds good

. In a dedicated listening space that is devoid of furnishings otherwise, then addition acoustic products would be necessary to get the reverberation times low.
BTW for this purpose you want to just look at one graph. I usually pick T30. Answering the earlier question of what these graphs are, REW uses regression analysis to estimate RT60. RT60 as you may know is the time it takes for the reverberations to decay 60 db. If you click on Impulse Response (IR) likely you will find that the decay is not that long. So REW uses shorter term decays to estimate "what may have been" if the graph kept going lower and lower (again, using regression analysis). The selection of the graph segment as the predictor of the rest is sort of encoded in the name of the graph. "EDT" uses the values between 0 and -10 db, T20 -5 and -25 db (i.e. 20 db differential) and 30 -5 and -35 db (i.e. 30 db differential). You will probably notice that the T20 and T30 are similar since the shape of the graph is probably established by the first decay chunk so no reason to use both. EDT is supposed to be the early decay time. I don't know of a use for that in small rooms and it is not as good as a predictor for the shape of the graph. So no need to check that.
So to summarize: look at T30 @500 Hz and keep the value between 0.3 and .5. Do not worry about small changes there or worrying about all the values being the same. This is a gross measure and not a accurate target to hit at due to limitations of small room acoustics mentioned earlier.
Assuming EDT is the lowest graph in light blue and hence can be ignored, then your room is already in target area. I would not be adding more absorptive material as that would start to push you toward the dead region. If you need more to say, absorb bass frequencies, I would look to remove some others.


